Animal handling, welfare, and monitoring
All procedures involving animals were approved by Laboratory Animal Welfare and Ethics Committee of Fourth Military Medical University (Approval No. 20180303), in compliance with the Guide for the Care and Use of Laboratory Animals published by the US National Institutes of Health. Male and female C57BL/6J mice (4-week-old) were obtained from the Experimental Animal Center of Fourth Military Medical University and housed in a SPF room with controlled temperature (22–24 °C) and humidity (40–60%). All mice were housed in a room with a 12 h light-dark cycle, free access to food and water and fed ad-libitum with regular rodent chow (#DOSSYJY-001, DOSSY). Sterilized cages and bedding were changed weekly. Regular monitoring for infectious agents was performed, and all tests were negative throughout the study. The mice were randomly divided into 2 groups: those with early-life exercise (EXE), and those without early-life exercise (SED). Mice involved in lifespan analysis were kept in the same room housing 5 males or 5 females per cage in the same room but without mating throughout their entire life.
Animals were checked daily during experiments and were monitored for agility, basic awareness and general well-being. Body weight and food intake were regularly examined throughout their lifespan. We adhered to 3 R principles of animal welfare. All animals involved in our studies were well cared for and free from unnecessary pain or stress.
Exercise model
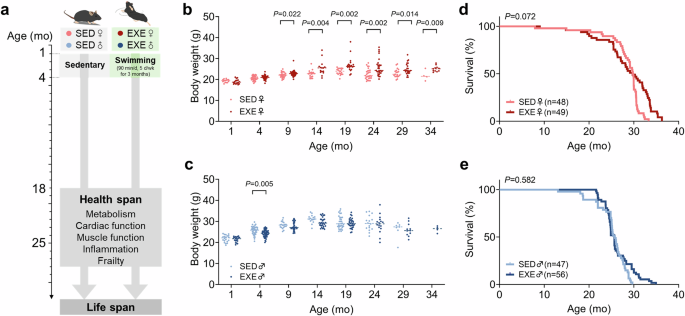
C57BL/6J mice (4-week-old) swam 90 min once daily for 5 days a week for 3 months. Mice were adapted to swimming training with a 30 min session on the first day. Sessions were then progressively increased to 90 min/day over a 1-week period. All exercise sessions took place during 19:00 p.m.–20:30 p.m. and the temperature of water was kept between 33–35 °C. The above training protocol was modified from a published article49. Tanks used for swimming were about 80 cm for length, 50 cm for width and 40 cm for height. Each tank contained 15–20 mice with same gender during swimming. The depth of water was 13–15 cm. Sedentary mice were age-matched and were kept in the same condition with 1–3 cm depth of water. Following 3 months of exercise training, mice were routinely housed without further training until death.
Survival
The principal endpoint of lifespan study was natural death. All mice were examined at least once daily. We recorded the age at which mice were found dead or selected for euthanasia. Euthanasia was performed on mice deemed unlikely to survive for the next 48 h and experiencing enormous discomfort. The criteria for euthanasia was based on an independent assessment by a veterinarian, which include severe lethargy, rapid weight loss (over two weeks >20%), severe distended abdomen and body condition score with signs of pain (grimace), inability to move despite the stimuli, severe ulcer or bleeding tumor, severe temperature loss with abnormal breathing rate. Mice were euthanized by intraperitoneal injection of not less than 150 mg/kg of sodium pentobarbital (Merck). A complete necropsy was performed on all mice and discernable tumors were recorded by a veterinarian and a clinician who were blinded to experimental conditions. The sample size was determined based on the ability to detect a 10% increase in lifespan with 80% power, using mean and standard deviations from published data50.
Body composition
Measurements of lean and fat mass in live mice were acquired by NMR using the Minispec LF90 (Bruker Optics, Billerica, MA) based on Time-Domain NMR.
Multi-parameter metabolic assessment
Mouse metabolic rate was assessed by CLAMS lab animal monitoring system (Oxymax-CLAMS, Columbus Instruments, USA). Briefly, mice with free access to water were subjected to a standard 12 h light/12 h dark cycle, which consisted of a 24 h acclimation period followed by 48 h of sampling. Sampling time included a 24 h free access of food and 24 h fasting time followed. Sample air was passed through an O2 sensor for determination of O2 content. O2 consumption was determined by measuring oxygen concentration in air entering the chamber compared with air leaving the chamber. All the sensor was calibrated before test. The concentrations of O2 and CO2 were monitored at the inlet and outlet of the sealed chambers to calculate oxygen consumption. Each chamber was measured for 30 s at 30-min intervals. Effective body mass was calculated by ANCOVA analysis. Respiratory quotient (RQ) was calculated as the ratio of VCO2/VO2, and total energy expenditure was calculated as VO2 × (3.815 + 1.232 × RQ), normalized to effective body mass, and expressed as kcal/h/kg Eff.Mass. FO and CHO were calculated as FO = 1.69 VO2 – 1.69 × VCO2 and CHO = 4.57 × VCO2– 3.23 × VO2 and expressed as g/d/kgEff.Mass 51.
Frailty index assessment
The frailty index originally established by Whitehead et al.52 are widely recognized as an effective index for mice frailty assessment. Deficits in body weight (g) and body surface temperature (°C) were scored based on deviation from reference values in young adult animals. The body surface temperature was assessed using an infrared thermometer (DELIXI Electric, China). Twenty-nine other items across the integument, physical/musculoskeletal, oscular/nasal, digestive/urogenital, and respiratory systems were scored on a scale of 0, 0.5, and 1 depending on the severity of the deficit in a blinded manner. Total score across the items was divided by the number of items measured to give a frailty index score between 0 and 1. It should be pointed out that for kyphosis frailty score from physical/musculoskeletal, inspection was needed for the mouse for its curvature of the spine or hunched posture. Then 0, 0.5, and 1 were used to score the kyphosis degree of mice: 0 means absent curvature, 0.5 means mild curvature and 1 means clearly hunched posture. The lower kyphosis frailty score means the less curvature of spine.
Micro-CT
The whole body of the mice was scanned using Quantum GX2 microCT Imaging System (PerkinElmer, USA). Scan parameters were set as follows: 90 kV, 80 μA and pixel size 288 μm. Based on the results of micro-CT scanning and reconstruction, the BMD was analyzed. Kyphosis index was calculated as the distance between the caudal margin of the last cervical vertebra to the caudal margin of the sixth lumbar vertebra (usually corresponding to the cranial border of the wing of the ilium) divided by a line perpendicular to this from the dorsal edge of the vertebra at the point of greatest curvature. The higher kyphosis index means less curvature of spine. Care was taken to avoid overextension or flexion of limbs.
Voluntary wheel running test
C57BL/6 mouse was randomly assigned to a running wheel-equipped cage (Vertical Wireless Running Wheel, Med Associates, USA). Free access to the wheel was allowed for every mouse in its cage. Running activity was monitored through a counter provided with each cage which counts whole counts of the activity wheel. For adaptation, all mice had access to wheels for 4 days before recording, and an average of running activity of the other 4 days were calculated as voluntary physical activity per day.
Glucose and insulin tolerance tests
Glucose tolerance test was performed by fasting the mice for 14 h overnight, followed by an intraperitoneal injection of glucose (1 g/kg). Insulin tolerance test (ITT) was performed by fasting mice for 4–6 h starting at lights on, and then injecting insulin (0.75 U/kg) intraperitoneally53. Blood glucose levels were measured using a blood glucose meter and test strips (ACCU-CHEK, Roche, Swiss).
Ultrasonic imaging
Echocardiography was performed using a Vevo 2100 high-resolution in vivo imaging system (VisualSonics Inc., Toronto, Canada) to assess the cardiac function. Mice were anesthetized by 1% isoflurane to maintain stable heart rate and body temperature. M-mode and two-dimensional measurements were acquired to assess cardiac function. Systolic function was evaluated using the parasternal short-axis view. Diastolic function was assessed from the apical 4-chamber view by measuring E/A and E/E’ ratios. E wave (early filling) and A wave (atrial filling) were measured using pulse-wave Doppler mode between the tips of the mitral valve. The above training protocol was modified from a published article54. hcPWV was measured by capturing flow pressure waveforms generated by cardiac activity and arterial pulses and calculated by dividing the distance length by the transit time. CCA diameter was measured under pulse-wave Doppler mode.
Measurement of vascular function
Mice were euthanized and the descending aorta was carefully excised and placed in ice-cold physiological saline solution. The contractile force was recorded using a Powerlab Chart v 7.2.1 program (model 610 M, Danish Myo Technology, Denmark). Aortic rings were precontracted with phenylephrine (PE, 10−3 M, Sigma, USA). Endothelium-dependent vasorelaxation was evoked by acetylcholine (ACh, 10−9 to 10−3 M, Sigma, USA), while endothelium-independent vasorelaxation was evoked by cumulative sodium nitroprusside (SNP, 10−9 to 10−3 M, Sigma, USA). The above training protocol was modified from a published article55.
Muscle performance tests
The forelimb grip strength of mice was measured using a grip-strength meter (BIO-GS3; Bioseb, Pinellas Park, FL, USA) with 5 measurements each mouse, and the average value was calculated. Prior to the test, the mice were acclimated to the rotarod with 3 trials every day for 3 days. The rotarod system (JLBehv-RRTG; Shanghai Jiliang Software Technology, Shanghai, China) accelerated from 4 rpm to 40 rpm over 5 min and maintained the maximum speed until the mice fell off. For the treadmill running capacity test, the mice were acclimated to the treadmill system (ZH-PT/5S, ZH, China) with 3 trials every day for 3 days. The treadmill was set at a 0° incline and initial speed of 5 m per minute. The speed was increased by 1 m per minute until exhaustion. Mice were motivated to run by a shock grid at the rear of the belt, and exhaustion time was recorded when the mice remained on the shock grid for more than 10 consecutive seconds. The above training protocol was modified from a published article56.
Muscle force tests
Mice were anesthetized by 1.5% isoflurane before detaching the muscle, and maintenance of isoflurane was supplied during whole procedure. Then the TA muscle was gently detached and attached to the apparatus (Aurora Scientific, Aurora, ON, Canada). Optimal resting length (L0) was determined through a series of twitches with each twitch separated by 30 s. L0 was the initial resting length where the muscle returned to after several pulses were administered. Force-frequency tests were assessed through electrical stimulations (10 V) at increasing frequency. Pause 5 min between stimulation bouts. Record force (in N) for each isometric contraction (P0). After testing, specific force (N/cm2) was determined for the TA by normalizing absolute force to physiological cross-sectional area, which was calculated as (P0N)/ [(muscle mass mg/1.06 mg/mm3)/Lf mm]. 1.06 mg/mm3 is the mammalian muscle density. Lf = L0 × 0.6, where 0.6 is the muscle to fiber length ratio in TA muscle57,58.
Respirometry of muscle fiber
Dissected gastrocnemius muscle strips were first immersed in ice-cold isolation solution (10 mM Ca-EGTA buffer, 0.1 μM free calcium, 20 mM imidazole, 20 mM taurine, 49 mM K-MES, 3 mM K2HPO4, 9.5 mM MgCl2, 5.7 mM ATP, 15 mM phosphocreatine, 1 μM leupeptin, pH 7.1). Individual fiber bundles were then separated with two pairs of sharp forceps and then the fiber bundles were permeabilized for 30 min in 3 ml of ice-cold isolation solution with saponin (50 μg/ml). After chemical permeabilization, the tissue was rinsed twice for 10 minutes in chilled mitochondrial respiration medium MiR05 (0.5 mM EGTA, 3 Mm MgCl2.6H2O, 60 mM potassium-lactobionate, 20 mM taurine, 10 mM KH2PO4, 20 mM HEPES, 110 mM mannitol, 0.3 mM dithiothreitol, 1 g/l BSA, at pH 7.1). The fiber bundles were then transferred immediately into the respirometer (Oxygraph-2k; Oroboros Instruments, Innsbruck, Austria). Fiber samples were run in duplicate in the two-chamber system after calibration. All experiments were performed at 37 °C. Resting respiration was assessed by addition of octanoylcarnitine (1 mM) and malate (2 mM) in the absence of adenylates. OXPHOS capacity of fatty acid oxidation with octanoylcarnitine was achieved by addition of ADP (5 mM). OXPHOS capacity with convergence of physiological electron supply to the Q-junction through Complexes I and II was stimulated by addition of succinate (10 mM). OXPHOS capacity of CHO was assessed by addition of 5 mM pyruvate, ADP and succinate step by step59. All measurements were conducted blinded to treatment groups.
Complete blood counts
For complete blood counts, blood samples were obtained from the tail vein. The blood was collected into EDTA-coated collection tubes and analyzed using a Mindray BC-30 Vet hematology analyzer (Mindray, China).
ELISA
The following commercially available ELISA kits were used to measure protein levels in plasma: mouse Insulin Elisa kit (Cusabio, Wuhan, China) and mouse CRP Elisa kit (Cusabio, Wuhan, China). Relative levels of cytokines and chemokines in plasma were determined by using the Mouse cytokine array panel A array kit (ARY006, R&D Systems, Minneapolis, USA). The manufacturer’s instructions were followed.
Histology and immunofluorescence
Tissues were collected after mice were anesthetized with 2% isoflurane. Fresh tissue was immediately fixed with 4% paraformaldehyde for 24 h. The tissue was then trimmed and dehydrated. Following OCT embedding, the tissue was sliced at a thickness of 10 μm. For gastrocnemius muscle, the region with the maximum cross-sectional area was sliced. H&E and Masson trichrome were used to evaluate tissue morphology and fibrosis, respectively. During the dewaxing process, environmentally friendly dewaxing transparent liquid (G1128, Servicebio) was used. The collagen volume fraction (%) was calculated as the ratio of collagen volume to fiber volume. For SA-β-Gal staining, sections were incubated with SA-β-Gal staining solution (9860, Cell Signaling Technology) overnight at 37 °C. After staining, slides were examined under a bright-field microscope (Zeiss).
For immunofluorescence, the sections were immersed in a 1X antigen retrieval solution (P0081, Beyotime) and then incubated at 95 °C for 10 min for antigen retrieval. Tissue sections were permeabilized by 0.2% Triton X (T8787, Sigma) for 10 min, and blocked in 1% bovine serum albumin for 20 min. The sections were incubated with primary antibodies overnight at 4 °C, including CD31 (ab9498, Abcam), CD11b (12-0112-82, Invitrogen) and laminin (ab11575, Abcam). Then slides were incubated with secondary antibodies conjugated with Alexa Fluor 488 (4408, Cell Signaling Technology) or Alexa Fluor 555 dyes (4413, Cell Signaling Technology) for 1 hour at room temperature. Nuclei were counterstained with DAPI (Invitrogen).
Imaging and quantification
The fluorescence was imaged using an inverted confocal microscope (Zeiss) or a slide scanner (OLYMPUS VS200). Endothelial integrity was quantified by calculating the ratio of CD31-positive aorta endothelial length to the entire aorta length. For quantification of the capillaries, all fibers in the slide were quantified by a blind observer. Capillaries were expressed as numbers per fiber. Automated quantitative analyses of capillary density were done by ImageJ software (v1.53). The images were converted into 8-bit grayscale images. For CD31 signal, the “Subtract Background” function (radius = 50 pixels) is applied to remove background noise, and then “Auto Threshold” (Otsu algorithm) is used to perform binary segmentation. The “Analyze Particles” module (particle size range: 5–100 μm², roundness 0.1–1.0) is used to identify capillary cross sections and exclude non-specific signals. The number of muscle fibers was then counted, and the capillary density was calculated. One tenth samples were randomly selected for manual review (ImageJ manual counting tool), and the results showed that the correlation coefficient between automatic and manual counting was R2 > 0.92 (Pearson test). For confocal imaged results, an average value of each slide was calculated from five random microscopic fields by a blind observer.
Western blot
Proteins from tissues were quantified using a bicinchoninic acid protein assay kit (23225, Thermo Fisher). Western blot analysis was performed using standard procedures, which was detected using an enhanced chemiluminescence western blotting detection kit (32106, Thermo Fisher), and was quantified by scanning densitometry according to the manufacturer’s protocols. Proteins were separated through electrophoresis and transferred to PVDF membranes. The membranes were incubated overnight at 4 °C with appropriate primary antibodies followed by incubation with the corresponding secondary antibodies at room temperature for 2 h. The primary antibodies were as follows: FASN (FASN, 3180S, Cell Signaling Technology), PPARγ coactivator-1α (PGC-1α, 2178S, Cell Signaling Technology), Atrogin 1 (67172-1-Ig, Proteintech), complex I (Invitrogen, 438800), complex II (Invitrogen, 459200), complex III (Invitrogen, 457125), complex V (Invitrogen, 459240), CD36 (18836-1-AP, Proteintech), carnitine palmitoyltransferase 1B (CPT1B, 22170-1-AP, Proteintech), carnitine palmitoyltransferase 1 A (CPT1A, 15184-1-AP, Proteintech), acyl-Coenzyme A dehydrogenase, long chain (ACADL, 17526-1-AP, Proteintech), p53 (10442-1-AP, Proteintech), p21 (28248-1-AP, Proteintech), p16 (554079, BD Pharmingen), phospho-p70S6K (Thr389) (9234, Cell Signaling Technology), total p70S6K (2708, Cell Signaling Technology), phospho-Akt (Ser473) (4060, Cell Signaling Technology), Akt (9272, Cell Signaling Technology), GAPDH (2118, Cell Signaling Technology) and α-tubulin (2125S, Cell Signaling Technology). α-Tubulin was used as a loading control. The original Western blots were provided in Source Data file.
Transcriptional profiling and analysis
Male mice used for transcriptional profiling were euthanized following an overnight fast. RNA was extracted from the heart, liver, gastrocnemius, and eWAT from male mice at different ages. Total RNA was extracted using Trizol reagent kit (Invitrogen, Carlsbad, CA, USA) according to the manufacturer’s protocol. RNA quality was assessed on an Agilent 2100 Bioanalyzer (Agilent Technologies, Palo Alto, CA, USA) and checked using RNase free agarose gel electrophoresis. The cDNA/ DNA/Small RNA libraries were sequenced on the Illumina sequencing platform by Genedenovo Biotechnology Co., Ltd (Guangzhou, China).
RNAs differential expression analysis was performed by DESeq2 software between two different groups. The genes with the parameter of p value below 0.05 were considered differentially expressed genes (DEGs). DEGs between young SED and old SED group were recognized as Aging DEGs, for these genes change due to aging. Exercise DEGs were identified by comparing between old SED and old EXE group. DEGs that increased with aging but decreased with exercise were categorized as “Rev-aging DEGs”, while those changing in the same direction were categorized as “Pro-aging DEGs.” DEGs classification was based on the established protocols outlined in a recent study60.
PCA, GO, KEGG pathway, and SEA analyses were performed using the OmicShare tools, a free online platform for data analysis (http://www.omicshare.com/tools).
Statistical analysis
All values are presented as mean ± SEM. Repeats (n) mean experiments performed using distinct samples. Survival analyses were compared using Log-rank, Breslow, and Tarone-Ware test. The maximal lifespan was defined as the lifespan of the longest lived 5% of individuals. Daily Chi-square tests were used to assess differences between pairwise groups on each day of the lifespan61. Kolmogorov–Smirnov normality test was used to analyze the normal distribution of the data. Categorical data were compared by Chi-square test, and intergroup comparisons were conducted using two-sided t tests. For analyses involving multiple comparisons, one-way or two-way ANOVA was applied, as specified in the figure legends. Differences were considered significant when P p p
Reporting summary
Further information on research design is available in the Nature Portfolio Reporting Summary linked to this article.