
The m6A landscape of localized prostate cancer
We quantified the epitranscriptomes of 162 primary localized prostate tumors using methylated RNA immunoprecipitation sequencing (meRIP-seq)22,23,24. All patients were clinically managed for National Comprehensive Cancer Network intermediate-risk disease via radical prostatectomy with curative intent25. Clinical annotation included pretreatment prostate-specific antigen (PSA) abundance, tumor size and extent (T category), surgical International Society of Urological Pathology (ISUP) Grade Group, biochemical relapse, subhistologies and age at diagnosis (Fig. 1a and Supplementary Table 1). Tumors were treatment naive, and samples were taken from index lesions as assessed by two uropathologists. Median follow-up was 6.72 years. Samples were profiled with multiple additional assays including tumor–reference whole-genome sequencing16,17,18,21, DNA methylation and histone H3 lysine 27 (H3K27) acetylation (H3K27ac) profiling16,18,20, RNA-seq19 and proteomics2 (Fig. 1a and Extended Data Fig. 1a).
Fig. 1: The m6A landscape of localized prostate cancer.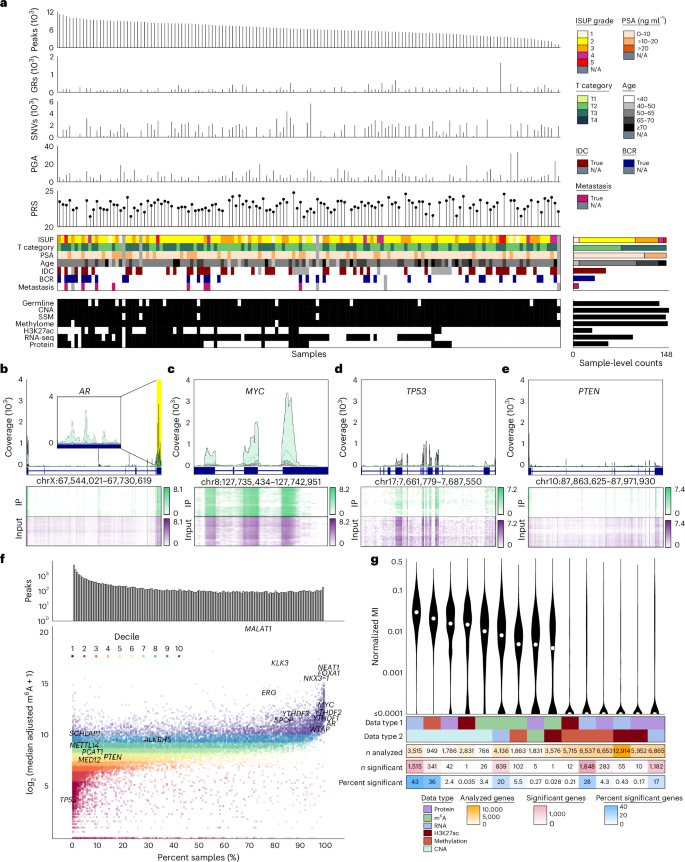
a, Top to bottom, bar plots. The number of MeTPeak peaks across samples ordered from greatest to smallest. The number of genomic rearrangements (GRs) identified in each sample. The number of single-nucleotide variants (SNVs) identified in each sample. The PGA40 as a proxy of the total CNAs for each sample. The Conti PRS50 calculated for each sample. Top heatmap shows the associated clinical covariates including ISUP Grade Group, anatomical T category, PSA, age, IDC/CA, biochemical relapse (BCR) and metastasis. Bottom heatmap, complementary molecular profiling data collected for each sample including germline polymorphisms in samples of European ancestry18, somatic CNAs and simple somatic mutations17, DNA methylome18, H3K27ac20, ultra-deep RNA-seq19 and proteomics2. SSM, simple somatic mutation; N/A, not available. b–e, Exemplar plots for AR (the inset magnifies the region highlighted in yellow; b), MYC (c), TP53 (d) and PTEN (e). In the top polygon plots, the median IP (green) and input (purple) coverage (reads per kilobase per million mapped reads-normalized bigWig files) is represented using lines, while background colors represent the range of IP and input coverage across samples. Exons identified in GENCODE version 34 are annotated below in dark blue. Bottom heatmaps represent the distribution of IP and input coverage (log1p transformed) across samples (y axis), and darker colors correspond to greater read coverage. Samples are clustered using Euclidean distance and Ward’s minimum variance method with squared distances. chr, chromosome. f, Top bar plot, the number of peaks uniquely found in a given number of samples. Bottom scatterplot, the median adjusted m6A abundance of a joint peak (y axis) versus the number of samples in which the peak is identified (x axis). Colors indicate the deciles of the adjusted m6A abundance. Multiple joint peaks can be identified in a single gene, but the most prevalent and abundant peaks for a given gene are labeled where applicable. g, Distribution of the normalized mutual information (MI) for each data type pair. For visualization, values −4 are shown as 10−4. Top heatmap indicates data type pair. Subsequent heatmaps show the number of genes with data available for each data type pair, numbers of genes for which mutual information is significant (Q
For each sample, two libraries were created and sequenced: an immunoprecipitation (IP) library generated by RNA IP with an anti-m6A antibody and an input library generated from the total RNA pool. After alignment and quantitation (Extended Data Fig. 1b), stringent quality control led to the exclusion of 14 samples (Extended Data Fig. 1c). In the final 148-patient cohort, input library results were strongly positively correlated with prior deep transcriptome sequencing (median Spearman’s ρ = 0.87; Extended Data Fig. 1d)19. Germline variants identified from input libraries validated sample identity (Extended Data Fig. 1e)18, and metrics from the ENCODE Consortium and other prior m6A studies were within expected ranges (Extended Data Fig. 1f)26.
m6A peaks were identified with both a highly specific algorithm (MeTPeak) and a highly sensitive one (exomePeak; Extended Data Fig. 2a)27,28. The number of peaks detected was modestly correlated with IP library size (Extended Data Fig. 2b), but read downsampling showed that libraries reached or approached saturation (Extended Data Fig. 2c,d)29. The vast majority of identified peaks overlapped known peaks (Extended Data Fig. 2e, inner panel)26, and the canonical RRACH motif was enriched in peaks identified in every sample30. Downstream analyses used high-specificity MeTPeak results (Fig. 1a and Extended Data Fig. 2e, outer panel).
To rationalize peaks cohort wide, we created an algorithm to integrate sample-level peaks into cohort-level joint peaks called HistogramZoo31. Briefly, peaks for each sample were aggregated onto transcript backbones, forming a coverage histogram for each transcript. These histograms were then segmented to create a set of joint peaks32,33,34,35. m6A methylation was quantitated for each sample on each peak as the number of IP reads, normalized for library size across the cohort36 and then adjusted for transcript abundance using matched input libraries37. In the full 148-patient cohort, HistogramZoo (Methods) identified 32,051 high-confidence m6A peaks across 9,571 genes; these were specifically enriched near stop codons (Extended Data Fig. 2f). The median tumor harbored 7,611 ± 2,922 m6A peaks (s.d.). Several key prostate cancer oncogenes such as MYC, AR, MALAT1 and FOXA1 had frequently methylated m6A peaks (Fig. 1b,c and Extended Data Fig. 2g,h), while tumor suppressors like TP53, PTEN and RB1 were very infrequently methylated (Fig. 1d,e and Extended Data Fig. 2i). One notable exception to the trend is NKX3-1, which was frequently methylated across samples (Extended Data Fig. 2j). About 16% of peaks were identified in a single sample (5,146 peaks), and ~20% were identified in at least half (6,467 peaks), with only 0.5% (167 peaks) detected in every sample (Fig. 1f).
To ascertain how m6A influences other aspects of the central dogma, we used mutual information, which can capture complex associations without assumptions of linearity or monotonicity38. For every gene, mutual information was calculated between each pair of molecular characteristics (Extended Data Fig. 1a). The number of genes with significant mutual information varied widely between different types of data (Fig. 1g and Supplementary Table 2). m6A was associated with RNA abundance for ~20% of analyzed genes (839 genes), with less frequent associations with copy number alterations (CNAs) (26 genes), DNA methylation (102 genes) and H3K27ac (one gene) (Fig. 1g). Genes with very low RNA abundance displayed fewer samples with a peak (Extended Data Fig. 2k), likely due to limitations in RNA signature detection. Similarly, a significant negative correlation was detected between m6A and RNA abundance (Extended Data Fig. 2l). The extent to which RNA explained protein abundance was weakly associated with mean gene-level m6A abundance but not with the number of samples for which the m6A peak was detected (Extended Data Fig. 2m,n). This provides minor support for previously reported regulatory roles of m6A in modulating RNA translation into protein23,39.
In addition to these 148 prostate tumor samples, we profiled benign tissue from seven individuals to allow tumor–normal comparisons (Supplementary Fig. 1 and Supplementary Tables 3 and 4). Furthermore, m6A-selective allyl chemical labeling and sequencing was applied to eight samples, facilitating single-nucleotide-resolution m6A profiling (Supplementary Fig. 2 and Supplementary Table 5). The analysis of these data is presented in the Supplementary Note.
m6A subtypes of localized prostate cancer
To identify global trends in m6A variation across patients, consensus clustering was performed on peak-level m6A abundance. We identified five patient subtypes (Supplementary Fig. 3a; P1 through P5) and five m6A subtypes (Supplementary Fig. 3b,c; M1 through M5; Fig. 2a and Supplementary Tables 6–8). m6A-derived patient subtypes were associated with multiple clinico-molecular features (Fig. 2b), including tumor size and extent (pathologic T category (pT); Fig. 2c), presence of the aggressive intraductal carcinoma and cribriform architecture subhistologies (IDC/CA; Fig. 2d), genomic instability assessed as the proportion of the genome with a CNA (percent genome altered (PGA)40; Supplementary Fig. 3d) and relapse rate after surgery (Fig. 2e; unadjusted P values shown) but not with tumor purity (Fig. 2a and Supplementary Fig. 3e).
Fig. 2: Molecular subtyping and clinical correlates of m6A.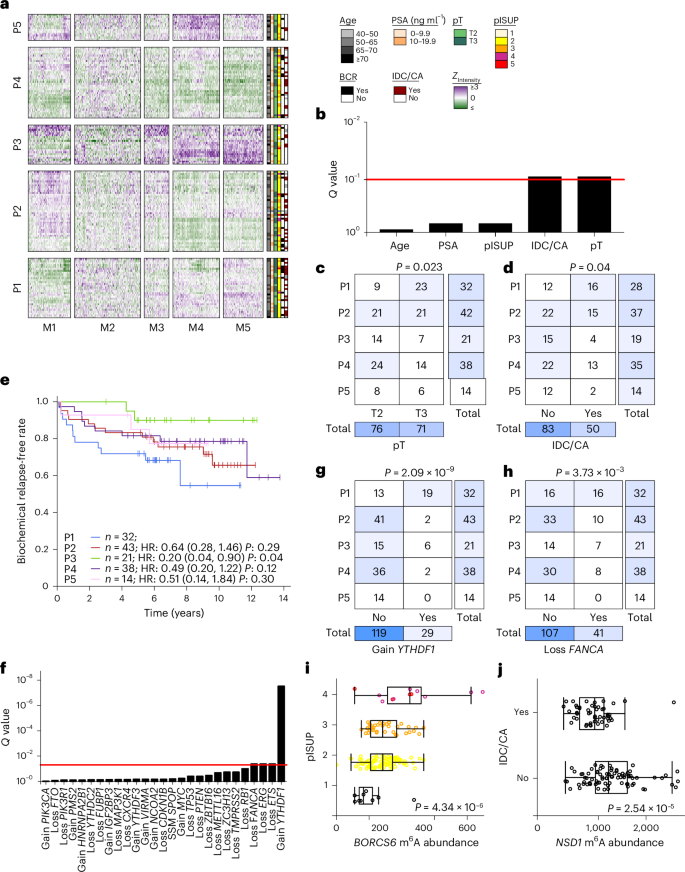
a, Clustering of the top quartile of interquartile range (IQR)-ranked m6A peaks (n = 5,203) identified five patient subtypes and five m6A subtypes. Clinical covariates are shown to the right of the heatmap. Heatmap coloring indicates z-score-scaled peak intensities. b, Association between m6A patient subtypes and clinical features. Q values are from Pearson’s χ2 test for categorical variables and a one-way ANOVA for continuous variables. c,d, Overlap of m6A patient clusters with pathologic tumor extent (pT) (c) and IDC/CA status (d). Patient clusters are indicated in rows, and clinical features are shown in columns. Row and column totals are depicted in the right and bottom heatmaps. Independence of clusters and clinical variables was assessed via Pearson’s χ2 test (P value shown). The relative intensity of blue shading indicates the size of the group. e, Biochemical relapse rate across the five m6A patient subtypes. A Cox proportional hazards model was fit with P1 as the baseline group. Hazard ratios (HR) and P values are shown with confidence intervals in parentheses. f–h, Association between m6A patient subtypes and mutations in m6A regulators. f, Bar plot shows Q values from Pearson’s χ2 test. ETS, E26 transformation-specific (ETS) transcription factor family members. g, Overlap of m6A patient clusters with presence of copy number gain of YTHDF1. h, Overlap of m6A patient clusters with presence of copy number gain of FANCA. Patient clusters are indicated in rows, and mutations are shown in columns. Row and column totals are depicted in the right and bottom heatmaps. Independence of clusters and mutations was assessed via Pearson’s χ2 test (P value shown). The relative intensity of blue shading indicates the size of the group. i, BORCS6 m6A peak abundance varies by pISUP Grade Group. P value from one-way ANOVA is shown (n = 148). Box plots represent the median (center line) and upper and lower quartiles (box limits), and whiskers extend to the minimum and maximum values within 1.5× the IQR. j, NSD1 m6A peak abundance is greater with presence of IDC/CA. P value from two-sided U-test is shown; samples where IDC status was missing have been removed (n = 133). Box plots represent the median (center line) and upper and lower quartiles (box limits), and whiskers extend to the minimum and maximum values within 1.5× the IQR.
m6A subtypes were related to known messenger RNA (mRNA) and CNA subtypes (Supplementary Fig. 3f,g), which themselves are associated with genomic instability and patient outcome16,19. The m6A subtypes were characterized by patterns of somatic CNAs in m6A writers, readers and erasers (Fig. 2f) including gain of YTHDF1 (Fig. 2g) and loss of FANCA (Fig. 2h). Thus, there are multiple m6A subtypes with distinct clinical presentations, which partially overlap previous DNA and RNA subtypes.
Clinical correlates of locus-specific m6A
Several clinical features of prostate cancer influence patient management, including age at diagnosis, pathological tumor extent (pT), pretreatment serum PSA abundance, pathological ISUP (pISUP) Grade Group and aggressive intraductal carcinoma subhistology (IDC/CA). For each clinical indicator, we identified individual m6A peaks associated with their status (Q 3a). Six m6A peaks were associated with age (Spearman’s rank correlation, Q 3b and Supplementary Table 9), eight peaks were associated with grade (one-way ANOVA, Q 2i), and 13 were associated with IDC/CA (two-sided Mann–Whitney U-test, Q NSD1, which enhances AR transactivation (Fig. 2j)41. The number of m6A peaks in a tumor was elevated in IDC/CA-positive disease (Extended Data Fig. 3c,d), and loss of the tumor suppressor genes FANCA and TP53 was more common in patients with more peaks (two-sided Mann–Whitney U-test, P 3e). Thus, locus-specific m6A patterns reflect clinical features of prostate cancer.
Heritable tumor-specific m6A regulation
Given that prostate cancer is the most heritable solid cancer42, we next considered whether germline genetics influence m6A methylation. First, we examined the potential cis regulatory effects of germline polymorphisms on m6A. Across all patients, around six million unique SNPs were identified18. Of these, 4,755 were located at the specific residue of a previously annotated m6A site43,44. We identified 35 germline polymorphisms that (1) overlapped an m6A peak identified in this cohort, (2) occurred at an m6A annotated site and (3) had an A allele on the transcribed strand (Extended Data Fig. 4a). A alleles in active m6A sites were present at much higher frequencies than non-A alleles (medianA, 0.83; rangeA, 0.11–0.95; mediannon-A, 0.45; rangenon-A, 0.053–0.95) (Extended Data Fig. 4b). A lower A allele frequency was observed at inactive m6A sites: that is, annotated sites lacking an m6A peak in localized prostate cancer (Extended Data Fig. 4b). This imbalance suggests that non-A alleles are associated with reduced m6A abundance. A quantitative analysis identified many SNPs associated with allelic imbalance of IP and/or input reads at the m6A site (Fig. 3a; paired t-test, Q GPR107 was associated with biochemical recurrence (Cox proportional hazards model, hazard ratio = 13.8; confidence interval, 3.2–60.3; Q = 6.3 × 10⁻³; ExaLT P = 2.0 × 10⁻²; Extended Data Fig. 4c). rs2240912 is neither a hit in prior GWAS studies45,46,47,48 nor in linkage disequilibrium with a GWAS SNP from those studies, likely due to the low minor allele frequency. Validation of its molecular effects and clinical consequences will be needed to better estimate its associations with disease aggression.
Fig. 3: Germline correlates of m6A in primary prostate cancer.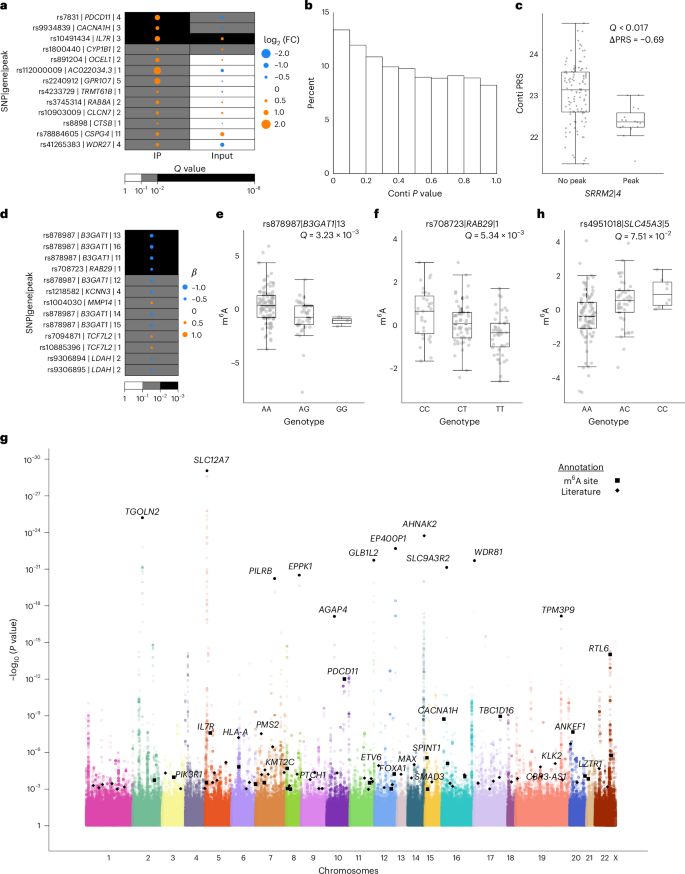
a, Allelic imbalance of reads at SNPs in annotated m6A sites in heterozygous samples in either the IP or input library. Allelic imbalance is evaluated using a paired t-test at a statistical threshold of Q 2 (fold change (FC))) is calculated with respect to the A allele. Effect size and direction are represented by the size and color of the disks, respectively. Statistical significance is represented by the background color. b, Distribution of P values in associations of m6A peak status with Conti PRS (t-test)50. c, m6A methylation of SRRM2 (peak 4) is associated with a lower Conti PRS (t-test). Box plots represent the median (center line) and upper and lower quartiles (box limits), and whiskers extend to the minimum and maximum values within 1.5× the IQR. n = 133. d, Significant prostate cancer risk SNP local m6A-QTLs identified using a linear additive model. Effect size (β) and direction are represented by the size and color of the disks, respectively. Statistical significance is represented by the background color. e,f, Two local risk SNP quantitative trait loci are depicted: the associations of genotype with m6A methylation for B3GAT1 (rs878987 | peak 13) (e) and RAB29 (rs708723 | peak 1) (f), respectively. Box plots represent the median (center line) and upper and lower quartiles (box limits), and whiskers extend to the minimum and maximum values within 1.5× the IQR. n = 133. g, Manhattan plot of genome-wide m6A-QTL analysis. Results from a linear additive model implemented in Matrix eQTL83. Points representing the tag SNPs of m6A-QTLs where the gene has been annotated in the Cancer Gene Census56 or by Armenia et al.57, Fraser et al.16 and Quigley et al.58 are indicated with black squares, while the SNPs of significant (Q 6A-QTLs where the SNP has been annotated in RMVar43 or by Cotter et al.44 are indicated with black diamonds. Labeled black disks selectively identify top hits that fall into neither of the former categories. SLC9A3R2 (NHERF2). h, A genome-wide significant m6A-QTL: SNP rs4951018 with SLC45A3 m6A abundance. Box plots represent the median (center line) and upper and lower quartiles (box limits), and whiskers extend to the minimum and maximum values within 1.5× the IQR. n = 133.
Next, to understand potential epitranscriptomic alterations characteristic of prostate cancer incidence, we evaluated the association of m6A peaks with two polygenic risk scores (PRSs) for incidence49,50 and one for hazard (PHS290)51 (Fig. 3b, Extended Data Fig. 4d–f and Supplementary Table 10). The number of m6A peaks across samples was weakly associated with polygenic risk (Fig. 1a and Extended Data Fig. 4g). The P-value distribution suggested that many subthreshold associations of m6A peaks with the incidence PRS remain to be elucidated in larger cohorts (Fig. 3b), and an m6A site in SRRM2 was associated with genetic risk (Fig. 3c and Supplementary Table 11).
We then related the 272 individual risk SNPs to m6A peaks within 10 kbp and to more distal m6A peaks identified using three-dimensional spatial genomic data52 (Extended Data Fig. 4h,i). We identified 13 local prostate risk SNP m6A tags, including six associated with peaks in B3GAT1 and one with a peak in RAB29 (Fig. 3d–f and Supplementary Table 12).
To generalize this observation, we identified m6A-QTLs genome wide, comparing each m6A peak to all SNPs within 10 kbp. This yielded 14,775 significant m6A-QTLs representing 1,350 unique peaks (Q 3g and Supplementary Table 13). Eleven percent (151 of 1,350) of the m6A-QTL SNPs overlap with the peaks they are associated with (Extended Data Fig. 4j), in concordance with previous studies showing that most of the m6A-QTLs are not located within m6A peaks53,54. Among these SNPs, 1% (14 of 1,350) overlap with methylated ‘A’ sites in the peaks (Supplementary Table 13). For SNPs that are located in regulatory regions, applying publicly available55 and in-house H3K27ac high-throughput chromosome conformation capture with chromatin immunoprecipitation (HiChIP) data, we found evidence of physical interactions between the m6A-QTL SNPs and the associated peaks in 4% (60 of 1,350) of SNP–peak pairs (Supplementary Table 13). These m6A-QTLs affected 1,017 genes, including 60 cancer or prostate cancer driver genes16,56,57,58,59. Of the 1,350 m6A-QTLs, 101 were associated with RNA abundance changes of the corresponding gene, nine with protein abundance changes and four with both (Q 4k). For example, rs4951018 was associated with changes in m6A, RNA and protein abundances of SLC45A3, a component of the common prostate cancer fusion gene SLC45A3-ELK4 (Fig. 3h and Extended Data Fig. 4l–n). Three independent m6A-QTL SNPs (rs143089027, rs57557217 and rs76338659) were associated with pISUP Grade Group (Pearson’s χ2 test, Q 4o). In sum, these data reveal broad germline regulation of m6A sites, including on cancer driver genes.
Broad m6A dysregulation by tumor hypoxia
Hypoxia is an adverse prognostic feature in localized prostate cancer associated with grade, IDC/CA and disease relapse17. We identified 2,280 hypoxia-associated m6A peaks (Spearman’s rank correlation, Q 4a and Supplementary Table 14). Hypoxia-associated peaks tended to be less abundant in hypoxic tumors and preferentially occurred on genes involved in gene expression regulation (Fig. 4a). The RNA abundance of m6A regulators was also correlated with hypoxia (Spearman’s rank correlation, P 4a). Further highlighting the widespread nature of the hypoxia–m6A relation, m6A patient subtypes (Fig. 2a) were hypoxia associated, with the mutationally quiet P5 cluster being the most normoxic (one-way ANOVA, P = 8.1 × 10⁻³; Fig. 4b). Eight peaks showed additional mutational or clinical associations, including a peak located on NSD1 (Figs. 2j and 4c,d and Supplementary Table 9).
Fig. 4: Tumor hypoxia is associated with widespread m6A modulation.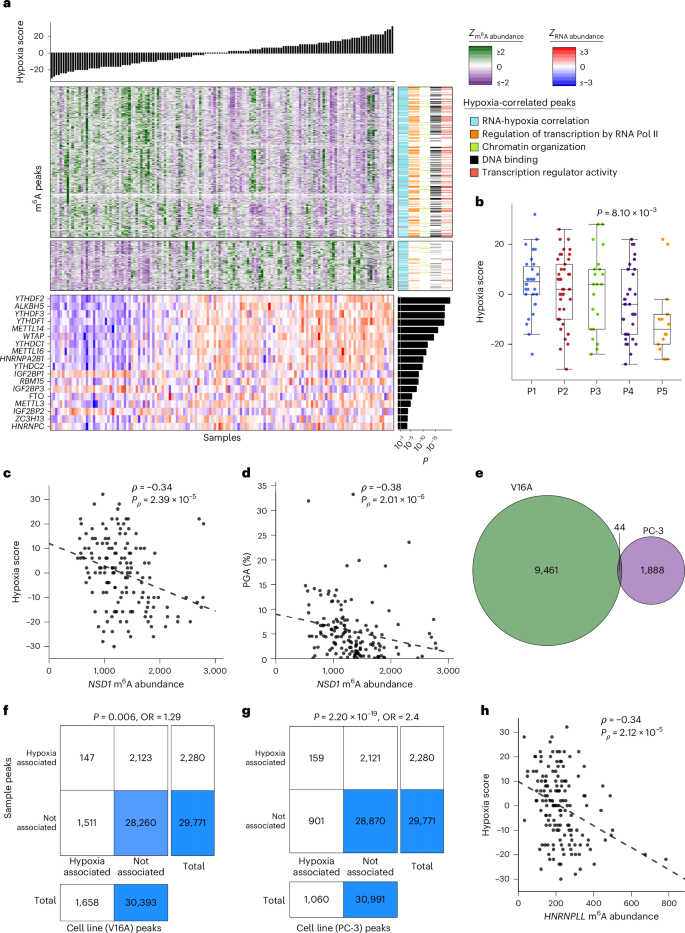
a, Hypoxia correlates with m6A peak abundance. Top bar plot indicates sample hypoxia score. Left–middle heatmaps show the corresponding z-scored m6A peak abundance per sample for peaks with a hypoxia correlation (Spearman’s correlation, Q 6A peak annotations. ‘RNA–hypoxia correlation’ indicates whether RNA abundance for the corresponding genes is also correlated with hypoxia. Hypoxia-correlated peaks are enriched for several biological pathways, and subsequent columns indicate whether each corresponding gene is tagged with each of the enriched pathway terms. Bottom heatmap shows z-scored RNA abundance for m6A writers, readers and erasers. Right bar plot shows P values for Spearman’s correlation between RNA abundance and hypoxia. Pol, polymerase. b, Patient m6A subtypes are associated with varying hypoxia levels. P value from one-way ANOVA. Box plots represent the median (center line) and upper and lower quartiles (box limits), and whiskers extend to the minimum and maximum values within 1.5× the IQR. n = 146. c,d, Associations between m6A abundance for an example peak on NSD1. Hypoxia (n = 146) (c), PGA (n = 148) (d). Plots annotated with results from Spearman’s correlation. e, Overlap between hypoxia-specific peaks in V16A and PC-3 cells. f,g, Patient hypoxia-associated peaks significantly overlap with hypoxia-specific peaks in prostate cancer cell lines. Contingency tables showing results from two-sided Fisher’s exact test for association between patient hypoxia-associated peaks and V16A (f) and PC-3 (g) hypoxia-specific peaks. The relative intensity of blue shading indicates the size of the group. OR, odds ratio. h, Correlation between tumor m6A abundance and hypoxia for a peak region in HNRNPLL. This peak shows a corroboratory hypoxia association in both V16A and PC-3 cell lines. Plots annotated with results from Spearman’s correlation (n = 146).
To validate these hypoxia-associated m6A peaks, we exposed two prostate cancer cell lines (V16A and PC-3) to 0.2% O2 for 24 h and profiled m6A using the same approach. Both cell lines had many hypoxia-specific peaks (Fig. 4e and Supplementary Table 15), with these peaks significantly overlapping the hypoxia-responsive m6A peaks in primary patients (Fig. 4f,g). Nine peaks showed a consistent hypoxia correlation across both cell lines in addition to patient samples, including HNRNPLL (Fig. 4h). Thus hypoxia correlates with m6A profiles in patients and model systems.
m6A is a biomarker of prostate cancer patient outcome
We next sought to evaluate the biomarker potential of m6A. The enzymes that read, write or erase m6A are frequently altered by somatic mutations, with a majority of tumors having a mutation affecting an m6A enzyme (Fig. 5a and Supplementary Table 16). Copy number loss of these genes was accompanied by reduced RNA and protein abundance in several instances (Extended Data Fig. 5a), and these modulations were associated with pISUP Grade Group for loss of METTL16 and gain of VIRMA, HNRNPA2B1 and YTHDF3 (Extended Data Fig. 5a). A majority (seven of nine) of these associations were replicated in the Cancer Genome Atlas (TCGA) Prostate Adenocarcinoma (PRAD) cohort (N = 421) (Supplementary Table 17). Similarly, RNA abundance of HNRNPA2B1 and YTHDC2 was also associated with ISUP Grade Group (Extended Data Fig. 5b).
Fig. 5: Quantifying the biomarker potential of m6A sites.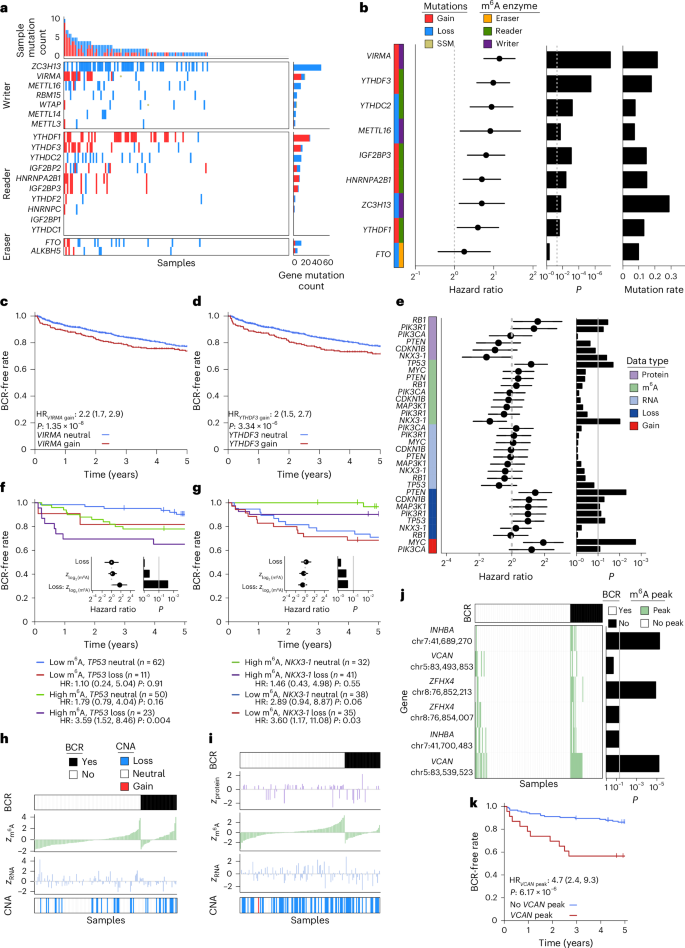
a, m6A regulatory genes are frequently mutated. m6A enzyme-encoding genes are shown on the y axis, and patient samples are on the x axis. Top bar plot represents the number of mutations per sample, while the right bar plot shows the number of mutations in each m6A regulatory gene across samples. Central heatmaps display the mutations in each enzyme for each sample. b–d, Meta-analysis of six independent patient cohorts identifies mutations in m6A regulatory genes as predictive of patient biochemical recurrence. b, Left heatmap depicts m6A regulatory gene, mutation type and category of m6A regulatory action. Forest plot shows hazard ratios and 95% confidence intervals of each mutation on biochemical recurrence, and left bar plot indicates corresponding P values from a Cox model. The far right bar plot displays average sample mutation rate across the patient cohorts (protein, n = 54, m6A, n = 148; RNA, n = 92; gain or loss, n = 146). c,d, Gain of VIRMA (c) and gain of YTHDF3 (d) predict decreased biochemical recurrence-free rate. VIRMA gain, n = 22; loss, 191. YTHDF3 gain, n = 23; loss, 186. P values displayed are from Cox proportional hazards models. e–i, m6A provides complementary prognostic information in profiling prostate cancer driver genes. e, Left heatmap shows driver genes and molecular data type analyzed. Forest plot shows hazard ratio and 95% confidence intervals for biochemical recurrence, and the right bar plot indicates corresponding P values from a Cox model. f,g, Influence of m6A and copy loss on biochemical recurrence-free rate for tumor suppressors TP53 (f) and NKX3-1 (g). Kaplan–Meier survival curves show the results from median dichotomizing m6A abundance to create four patient groups, while inset forest plots show results from treating m6A as a continuous variable. P values displayed are from Cox proportional hazards models. h,i, Relative m6A abundance by biochemical recurrence status for TP53 (h) and NKX3-1 (i). Plots show copy number, z-scored RNA, m6A and protein abundance, and biochemical recurrence status at censoring time. Patients are depicted in columns and are ordered by biochemical recurrence status followed by m6A abundance. j,k, m6A peak status predicts biochemical recurrence for specific peak sites on INHBA, VCAN and ZFHX4. j, Patients are represented in columns. Top heatmap displays biochemical recurrence status at censoring time. Middle heatmap shows patient peak status (peak sites depicted in row labels). Right bar plot shows P values from a Cox model. k, Presence of a VCAN m6A peak increases risk of biochemical recurrence. VCAN peak, n = 23; no peak, 125. P values displayed are from Cox proportional hazards models.
To further investigate the clinical importance of these m6A regulator mutational profiles, we analyzed six independent cohorts comprising 1,239 patients16,17,59,60,61,62. CNAs were significantly predictive of disease relapse (Fig. 5b), with the strongest effect sizes being observed for gain of the m6A regulators encoded by VIRMA and YTHDF3 (Fig. 5b–d and Supplementary Table 18). Furthermore, CNAs in prognostic m6A regulatory genes co-occurred with spatially distant prostate cancer driver events, providing evidence of positive selection (Extended Data Fig. 5c). Of these significantly co-occurring driver–m6A CNA events, 52% (29 of 56) replicated in the TCGA-PRAD cohort (Supplementary Table 19).
Mutations in m6A enzymes may determine patient outcomes through direct modification of site-specific m6A. We investigated whether these mutations, in addition to canonical prostate cancer driver events, were associated with differential methylation of m6A peaks. Of the 6,467 m6A peaks identified in at least 50% of samples, over half (3,432 peaks) were differentially methylated in relation to a prostate cancer driver or m6A regulator, with clustering by effect size resulting in five peak clusters and five mutation clusters (MC; Extended Data Fig. 5d and Supplementary Table 20). A subset of m6A clustering reflects known mutational co-occurrence, such as for YTHDF1 gain and FANCA loss (MC4, Extended Data Fig. 5c,d). In many cases, unrelated somatic mutations yielded similar m6A profiles, suggesting convergent epitranscriptomic dysregulation (for example, ZC3H13 and SPOP (MC5)). Co-regulated peaks were enriched for specific biological functions. MC1 preferentially dysregulates several pathways relating to cellular organization, while MC4 was associated with regulation of nucleic acid metabolism and RNA methylation (Extended Data Fig. 5e and Supplementary Table 21). Thus, in addition to predicting patient outcome, the somatic mutation landscape influences the epitranscriptome in a driver- and regulator-specific manner.
We next examined the clinical importance of locus-specific m6A on known prostate cancer drivers. A comprehensive survival analysis of canonical prostate cancer driver genes across available biomolecular data types was performed (Fig. 5e and Supplementary Table 22). Consistent with previous findings, CNAs were predictive of biochemical recurrence for a subset of driver events (MYC, PIK3R1 and PTEN16,63). For tumor suppressors TP53 and NKX3-1, gene-level m6A abundance provided significant prognostic information (Fig. 5e). Median dichotomization of m6A revealed a trend toward increasing risk of biochemical recurrence upon TP53 loss in the context of higher m6A abundance. Further investigation identified a significant interaction effect, with a hazard ratio of 3.35 per standard deviation increase in log2 (m6A) abundance in patients with TP53 loss (Fig. 5f,i). Finally, we expanded the biomarker evaluation transcriptome wide by considering the 20,334 m6A peaks identified in at least six patients. Strong associations with biochemical recurrence were detected for peaks on the INHBA, VCAN and ZFHX4 transcripts (Fig. 5j, Extended Data Fig. 5f and Supplementary Tables 9 and 23). Additional peaks present on these transcripts showed a similar trend for association with biochemical recurrence but with nonsignificant effect sizes (Fig. 5j). The presence of each peak was associated with worse patient outcome (Fig. 5k and Extended Data Fig. 5g,h). In summary, m6A provides prognostic value in patients with prostate cancer via both epitranscriptomic and somatic mutational information.
m6A modification of VCAN associates with prostate cancer progression
To gain deeper insights into the intricate mechanisms underlying the relationship between m6A peaks and tumorigenesis, we conducted a more detailed exploration. The RNA abundances of VCAN, INHBA and ZFHX4 were significantly correlated in two large patient cohorts (Extended Data Fig. 6a). VCAN m6A peaks were observed in ~15% of tumors, while INHBA and ZFHX4 peaks were observed in 5%. A second VCAN peak correlated well with tumor hypoxia (Supplementary Table 14), prompting further investigation.
VCAN encodes a large chondroitin sulfate proteoglycan called versican (VCAN). It is a key component of the extracellular matrix64; the secretion of VCAN by fibroblasts promotes prostate cancer invasion65. The mRNA abundance of VCAN is significantly higher in tumors with m6A peaks than in those without (Extended Data Fig. 6b). The abundance of VCAN protein is also higher in tumors with m6A peaks (Extended Data Fig. 6c). Among the five prostate cancer cell lines tested, PC-3 had the highest level of VCAN m6A (Extended Data Fig. 6d), comparable to patient samples. High abundance of VCAN mRNA was significantly associated with a worse outcome in five cohorts comprising 981 independent patients (Fig. 6a and Extended Data Fig. 6e).
Fig. 6: VCAN drives proliferation and progression in vitro and in vivo.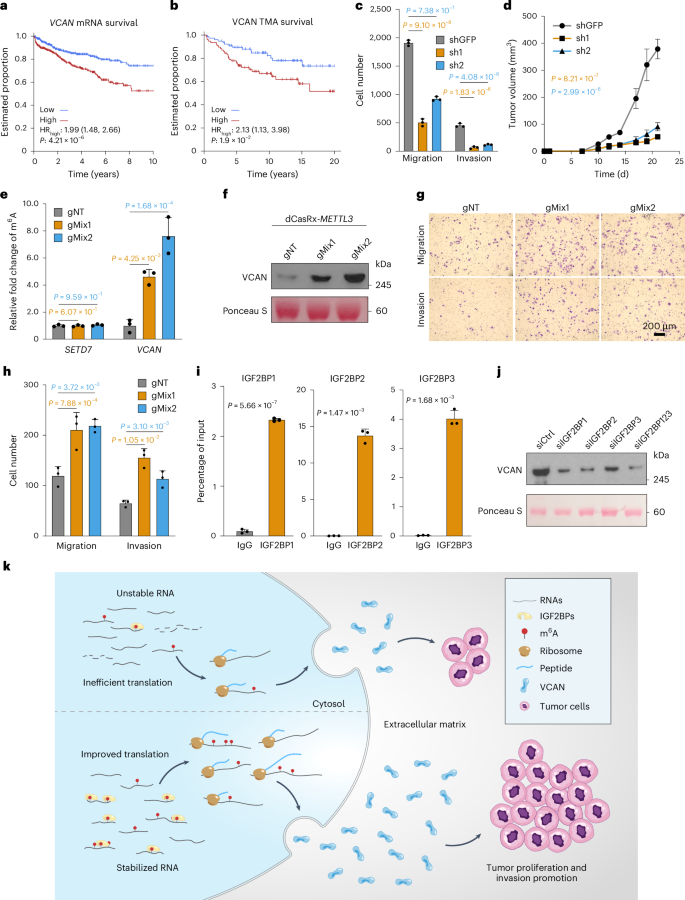
a, Kaplan–Meier survival curves showing biochemical recurrence stratified by VCAN mRNA abundance across five cohorts (Gerhauser, Ross-Adams, Taylor, TCGA-PRAD and International Cancer Genome Consortium (ICGC)-PRAD-CA (CA, Canada)), grouped by median abundance of VCAN mRNA. A Cox proportional hazards model was used to compare the hazard of biochemical recurrence between the groups. b, Kaplan–Meier survival curves showing biochemical recurrence stratified by VCAN average optical density from the tissue microarrays (TMA), grouped by median VCAN average optical density. A Cox proportional hazards model was used to compare the hazard of biochemical recurrence between the groups. c, Quantification of a migration and invasion assay after shRNA-mediated knockdown of VCAN in PC-3 cells. Data are represented as mean ± s.d. of three biological replicates. P values were calculated using one-way ANOVA with Dunnett’s multiple-comparisons test. d, Tumor growth of xenografts derived from injected PC-3 cells infected with shRNAs targeting VCAN or green fluorescent protein (GFP) as the control. Data are shown as mean ± s.e.m. of five biological replicates. P values are from one-way ANOVA with Dunnett’s multiple-comparisons test. e, Writing efficiency was assessed by m6A meRIP-quantitative PCR (qPCR) in PC-3 cells. SETD7 was introduced here as a negative control. Data are represented as mean ± s.d. of three biological replicates. P values are calculated using one-way ANOVA with Dunnett’s multiple-comparisons test. g, guide RNA; gNT, non-targeting guide RNA. f, VCAN protein abundance after dCasRx-METTL3-based m6A writing in PC-3 cells was detected by western blot. Ponceau S stain serves as the loading control. Numbers on the right indicate the positions of molecular mass (kDa) standards. g,h, Migration and invasion of PC-3 cells after writing by the dCasRx-METTL3-based RNA-editing system guided by VCAN mRNA-targeting guide RNA mixes. Representative images (g) and quantification (h, mean ± s.d. of three biological replicates; one-way ANOVA with Dunnett’s multiple-comparisons test) are shown. Scale bar, 200 μm. i, RIP–qPCR showing the physical association of VCAN mRNA with IGF2BPs in PC-3 cells. Data are represented as mean ± s.d. of three biological replicates. P values were calculated using an unpaired two-sided Student’s t-test. IgG, immunoglobulin G. j, Western blot showing VCAN protein abundance change after knocking down each IGF2BP protein (siIGF2BP1, siIGF2BP2 and siIGF2BP3) or all three IGF2BPs (siIGF2BP123) in PC-3 cells. Ponceau S stain serves as the loading control. Numbers on the right indicate the positions of molecular mass (kDa) standards. Ctrl, control. k, Graphical representation of VCAN regulation by m6A.
VCAN protein abundance showed a trend but was not significantly associated with patient survival, possibly due to the relatively small sample size (Supplementary Fig. 4a). To address this limitation, we performed immunohistochemistry staining of VCAN in a tissue microarray with a larger sample size (n = 154). The staining results revealed the presence of VCAN in both tumor cells and stromal cells, albeit in modest amounts, with its primary localization observed in the extracellular matrix (Supplementary Fig. 4b). Importantly, patients with higher levels of VCAN had significantly poorer survival outcomes than those with lower levels (Fig. 6b and Supplementary Table 24). Furthermore, we observed a significant increase in the total amount of VCAN protein in tumors compared to normal tissues (Supplementary Fig. 4c). Additionally, VCAN abundance was notably elevated in high-risk groups compared to low- and intermediate-risk groups (Supplementary Fig. 4d). These findings highlight the prognostic value of VCAN in prostate cancer.
Knockdown of VCAN using short hairpin RNA (shRNA) or small interfering RNA (siRNA) significantly reduced cell proliferation, migration and invasion in PC-3 cells (Fig. 6c, Supplementary Fig. 4e and Extended Data Fig. 7a–g). VCAN knockdown with shRNA significantly reduced xenograft tumor growth in vivo (Fig. 6d and Extended Data Fig. 7h). Cell extravasation, which is a key step during cancer metastasis, was reduced after VCAN suppression in vivo in a chick embryo model (Extended Data Fig. 7i and Supplementary Videos 1–3). RNA-seq of PC-3 mouse xenografts with and without shRNA-mediated knockdown of VCAN identified 2,050 differentially expressed genes (Extended Data Fig. 7j), with downregulated genes enriched in cell adhesion, consistent with decelerating cell growth and motility (Extended Data Fig. 7k). In sum, in vitro, in vivo and clinical data suggest that VCAN drives aggressive prostate cancer.
VCAN-mediated cross-talk in prostate cancer progression
VCAN is recognized as a pivotal constituent in prostate stroma, secreted by fibroblasts, and exerts substantial influence on tumor initiation and progression65,66. To explore cross-talk between tumor and stromal cells in VCAN-mediated prostate cancer progression, we used the human prostate fibroblast cell line WPMY-1, which expresses an abundance of VCAN comparable to PC-3 cells (Extended Data Fig. 8a). Knocking down VCAN in WPMY-1 cells significantly reduced proliferation, underscoring its pivotal role in facilitating cellular proliferation (Extended Data Fig. 8b). Co-culturing PC-3 and WPMY-1 cells enhanced PC-3 motility in a dose-dependent manner with increasing WPMY-1 cell numbers (Extended Data Fig. 8c,d). Furthermore, co-culturing PC-3 cells with WPMY-1 cells with either VCAN or control knockdown (Extended Data Fig. 8e,f) showed that WPMY-1 could rescue the phenotype caused by VCAN knockdown (Extended Data Fig. 8g,h), suggesting that the phenotype was VCAN dependent. These findings highlight the complex interplay between tumor and stromal cells mediated by VCAN in prostate cancer progression.
m6A on VCAN drives prostate cancer aggression
Given that tumors with m6A peaks have higher VCAN mRNA abundance, we hypothesize that the m6A modification stabilizes VCAN mRNA. We initially observed that VCAN mRNA abundance decreased with METTL3 knockdown and increased with ALKBH5 and FTO knockdown (Extended Data Fig. 9a–c). To confirm that VCAN m6A modifications directly influence VCAN gene expression, we used catalytically dead CasRx (dCasRx)/METTL3-based programmable site-specific base editing on VCAN transcripts. meRIP–qPCR showed that, guided by the VCAN-targeting guide RNAs, the modification level on VCAN was significantly increased, while SETD7 as a negative control was unchanged (Fig. 6e). After m6A writing, VCAN mRNA and protein abundance was significantly increased (Fig. 6f and Extended Data Fig. 9d), consistent with perturbation of m6A regulators. In contrast to knockdown of VCAN, writing additional m6A modification enhanced proliferation and migration of PC-3 cells (Fig. 6g,h and Extended Data Fig. 9e). These data suggest that specific m6A modifications on VCAN stabilize its mRNA and promote subsequent translation to functional protein.
To elucidate the regulatory mechanisms of m6A modification on VCAN expression, we investigated the involvement of m6A readers in regulating VCAN mRNA or protein abundance. YTHDF1 was initially considered a potential regulator of VCAN expression. However, analysis of publicly available YTHDF1 RNA immunoprecipitation sequencing (RIP-seq) data, including in PC-3 cells, revealed that VCAN is not a target of YTHDF1 (refs. 67,68,69,70). Furthermore, knockdown of YTH domain readers (YTHDF1–YTHDF3) in PC-3 cells did not affect VCAN protein abundance (Extended Data Fig. 9f–j). However, despite the lack of involvement of YTH domain-containing readers in VCAN regulation, previous studies have reported VCAN as a high-confidence target shared by the m6A readers IGF2BP1–IGF2BP3, which stabilize target mRNA and promote translation71. We tested whether the IGF2BP proteins also bind VCAN mRNA in PC-3 cells by the RIP assay. Significant enrichment of VCAN was detected in all three pulldowns (Fig. 6i and Extended Data Fig. 9k). Knockdown of these three readers also reduced VCAN mRNA and protein abundance (Fig. 6j and Extended Data Fig. 9l,m). Consistent with VCAN knockdown, cell proliferation and invasion were also significantly reduced upon suppression of these three readers (Extended Data Fig. 10a–c). Ribosome profiling revealed increased VCAN abundance in the polysome-free fraction upon IGF2BP knockdown (Extended Data Fig. 10d,e). A rescue assay introducing m6A modification onto VCAN mRNA under the background of IGF2BP2 knockdown restored VCAN expression and cell phenotypes (Extended Data Fig. 10f). These data support a mechanism for m6A modifications to increase VCAN mRNA abundance by stabilizing and promoting its translation through IGF2BP proteins, enhancing prostate cancer cell aggression (Fig. 6k).