Preparation of preliminary data
In all samples, the proportion of clean reads was higher than 99.5% (Table S2), the proportion of reads with a Q (quality) score greater than or equal to 20 (i.e., Q20) was higher than 95.34% (Table S3), and the proportion of reads aligning to ribosomal sequences was less than 2.11% (Table S4). Therefore, the sequencing quality of this study was reasonable. Of the reads that aligned to the reference genome (Table S5), the proportion of sequencing reads that aligned to exon regions for all samples was above 87.20% (Table S6), indicating a relatively complete reference genome. This study identified transcripts that map to novel genes in the genome (Table S7). Generally, the amount of sequenced_Refer_Genes was higher than 64.19%, and the amount of sequenced_Novel_Genes was higher than 68.02% (Table S8), also indicating a relatively complete reference genome. Among all samples, the genes with gene coverage ranging from 80 to 100% were the most common, accounting for over 65.16% of all genes identified (Figure S4). When the sequencing depth reached 30 reads (× 1000000), the number of genes detected in five samples tended to be saturated (Figure S5). Sequencing saturation indicated that subsequent research could continue.
Sample relationship analysis
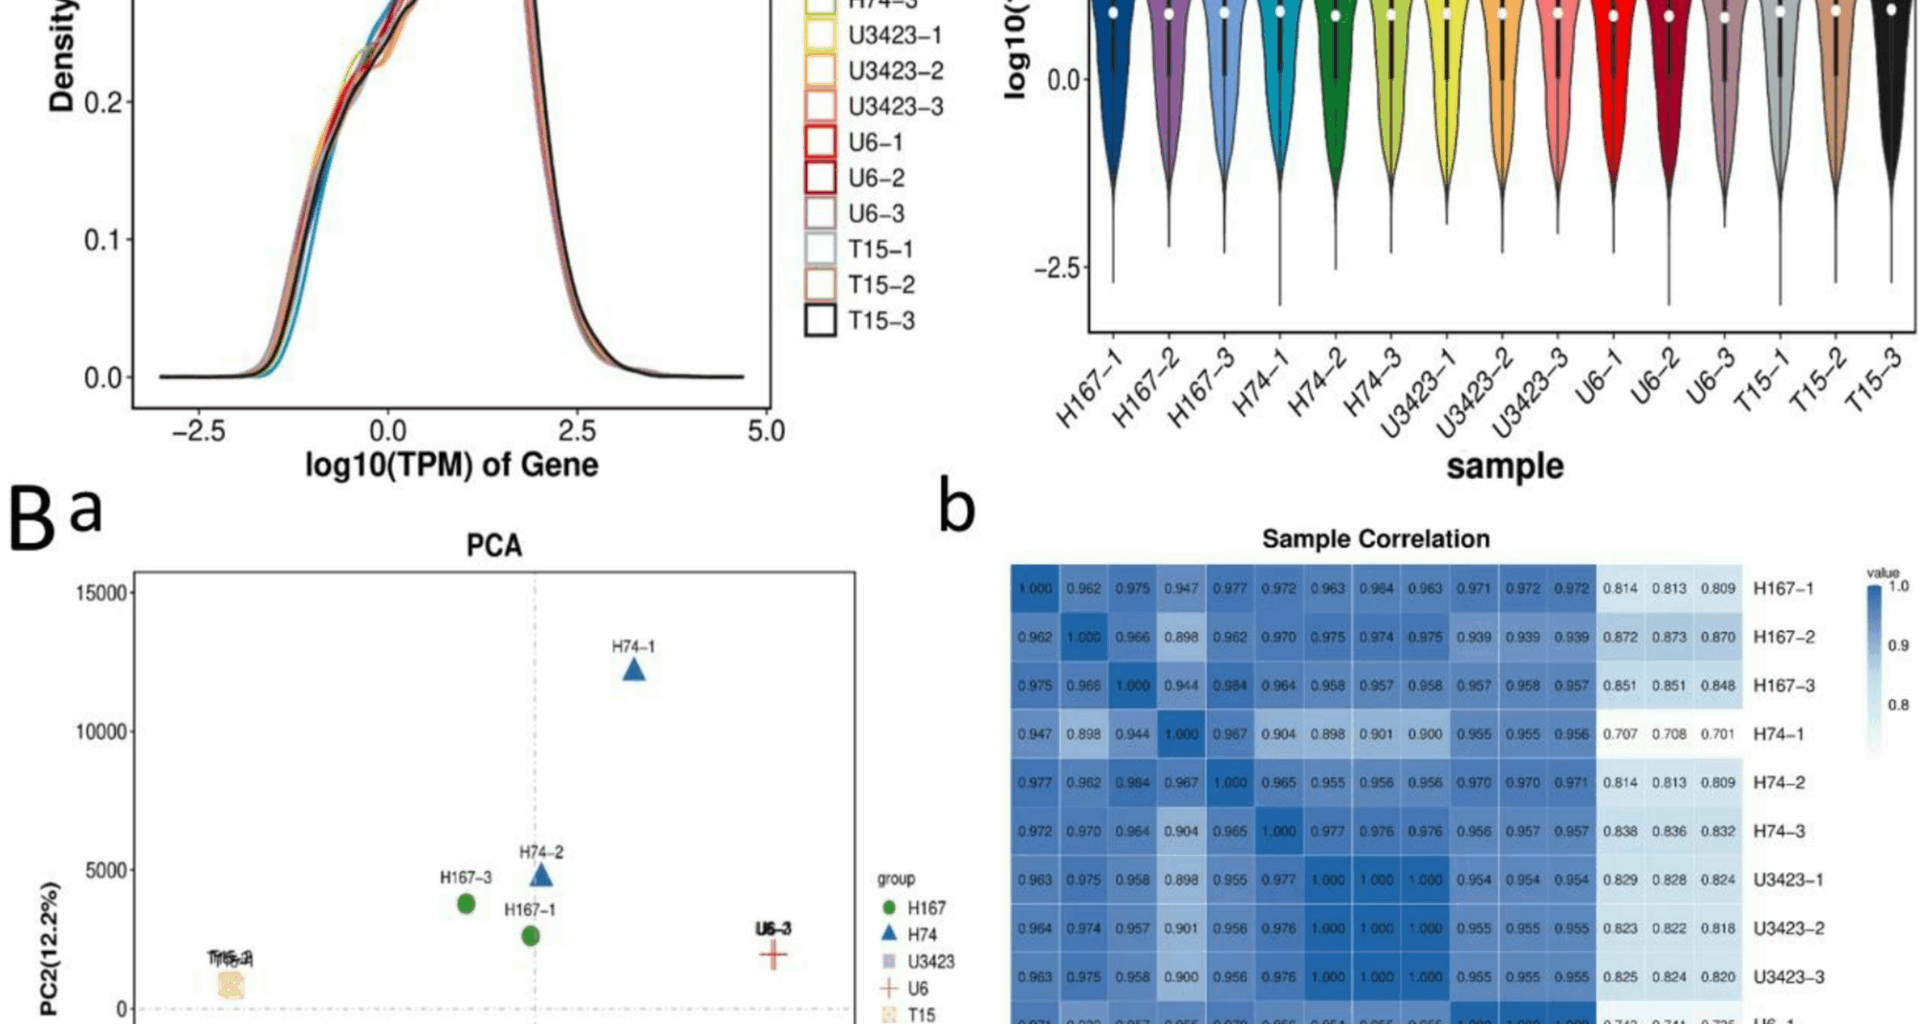
Based on the TPM values of each gene (Table S9), the gene abundance was highest when log10 (TPM) was 1–2, and there was only one peak in gene abundance for each sample (Fig. 1Aa). Across the samples, the median log10 (TPM) values were similar (horizontal lines ≈ 1.5–2.0). However, all three replicates of genotype T15 displayed narrower upper-quartile ranges (shorter top whiskers), which might indicate technical bias in long-transcript capture (e.g., due to RNA fragmentation during library preparation) (Fig. 1 Ab). All downstream analyses (DEGs, heatmap) utilized gene-length-adjusted TPM and DESeq2 normalization to mitigate such biases. Therefore, the biological differences observed in Fig. 1Bb and DEG analyses were considered valid.
Fig. 1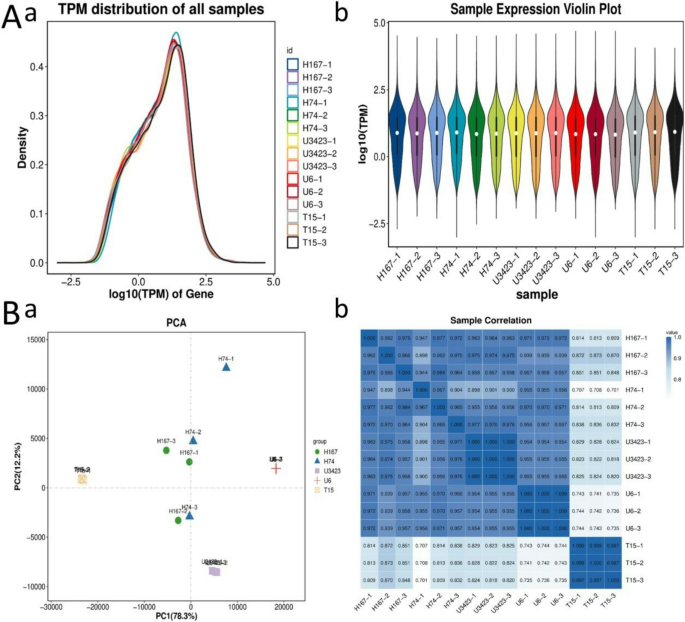
Gene expression and sample relationship analysis (Note: A: Gene expression distribution. a: Gene expression abundance distribution plot (The X-axis in the figure is log10 (TPM), the Y-axis represents the abundance of genes.); b: Violin plot of gene expression levels. B: Sample relationship analysis. a: PCA of Samples; b: Sample correlation heatmap.)
The expression levels of the three parents remained relatively stable across the replicates (Fig. 1B). PCA revealed distinct clustering patterns among genotypes, with the first two principal components accounting for 90.5% of the total variance. H167 and H74 exhibited tight intra-group clustering, forming spatially separated clusters along the PC1. T15, U6, and U3423 occupied peripheral positions distinct from hybrids (PC1, PC2). It implied that there were differences in transcriptome levels between parents and hybrids, as well as between the two hybrids. The pronounced separation between H167 and H74 highlighted their phenotypic divergence (PC2). On the PCA plot, H167 clustered more closely with the common parent of the two hybrids, U3423 (male), than with its other parent, T15 (female) (Fig. 1Ba). Similarly, the correlation between H74 and the male parent U6 was much higher than its correlation with the female parent U3423 (Fig. 1Bb). Therefore, we preliminarily speculated that the exceptional growth of the elite parent U3423 was more likely to be inherited by its hybrid progeny.
There were a maximum of 5157 DEGs between H167 and T15. There were 4460 differentially down-regulated genes between H74 and U3423 (Figure S6a), significantly higher than among the other comparisons. Since there were more DEGs between the female parent and the hybrid, genes related to eucalypt growth differences were narrowed down using the DEGs between the male parent and the hybrid. There were many genes that were significantly differentially expressed between H74 and U6 (Figure S6b-f). The gene expression patterns in each comparison in this study were similar, and the differences in expression levels were also significant (Figure S7). This indicated that it was feasible to search for genes related to differences in eucalypt growth by comparing gene expression patterns.
Enrichment analysis
Due to the limitations of gene expression analysis in characterizing the biological relevance of differentially expressed genes, enrichment analysis was used to explore the genetic mechanisms of heterosis. Through GO enrichment analysis, it was determined that four DEG pathways were shared by H167 vs. H74, H167 vs. T15, H167 vs. U3423, and H74 vs. U3423, namely ‘extracellular region’ (GO: 0005576), ‘external encapsulating structure’ (GO: 0030312), and ‘cell periphery’ (GO: 0071944). The Qvalue of the three GO pathways was 0.0 (α = 0.05). Through KEGG enrichment analysis, it was found that there were three DEG pathways shared by the four comparisons, but the Qvalues of KO00909 and KO00061 were 0.10411 and 0.356548, respectively, which did not satisfy the Qvalue threshold of 0.05. Therefore, one KEGG pathway ‘Plant-parent interaction’ (KO04626) was selected, with Qvalue = 0.091886 (α = 0.05) (Fig. 2; Table 2; Figure S8-10). Figure 2 is a partial display of the enrichment circle diagram, and the complete enrichment circle diagram can be found in Figure S8.
Table 2 Common DEG pathways among 5 comparisons in GO and KEGG enrichment analysisFig. 2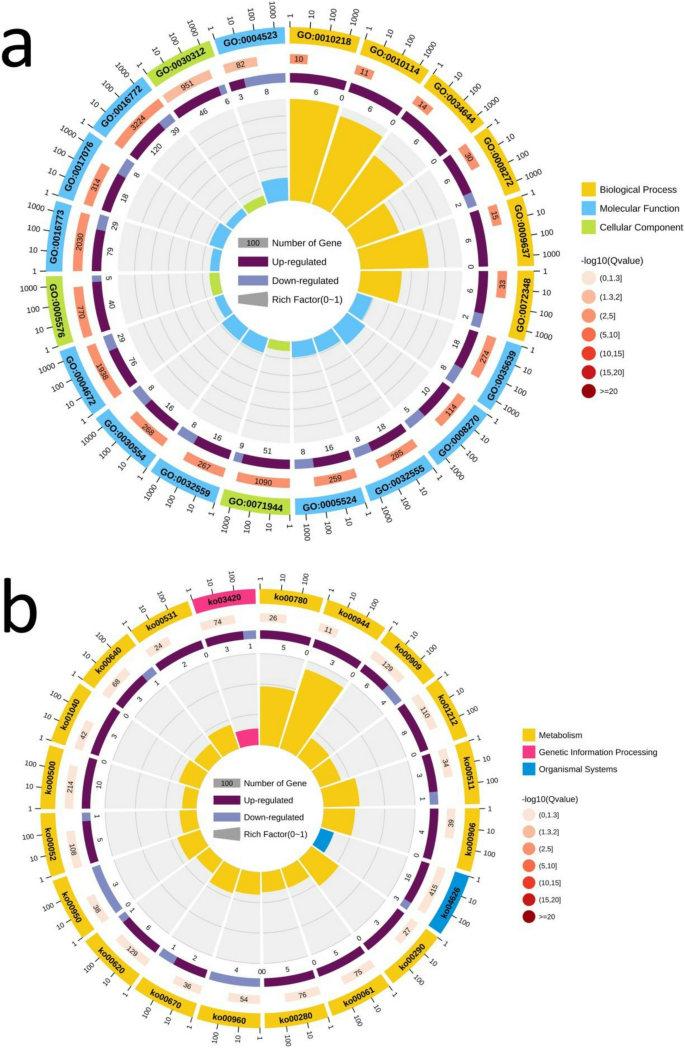
Enrichment circle diagram (Note: The manuscript image only shows one comparison, H167 vs. H74. a: GO; b: KEGG. First circle: The 20 most enriched GO terms/KEGG pathways, and outside the circle is the coordinate ruler of the number of DEGs. Different colors represent different GO terms/KEGG pathways; Second circle: The number and Qvalue of the GO terms/KEGG pathways in the differential gene background. The more differential gene backgrounds there are, the longer the bars, and the smaller the Qvalue, the redder the color; Third circle: Bar chart of the proportion of up-regulated and down-regulated DEGs, with dark purple representing the proportion of up-regulated DEGs and light purple representing the proportion of down-regulated DEGs; The specific numerical values are displayed below; Fourth circle: RichFactor values (the number of differentially expressed genes was divided by the total number of genes) for each GO term/KEGG pathway. Each Line on the grid represents 0.1.)
For the GSEA-GO analysis results, the DEG pathways ‘large ribosomal subunit’ (GO: 0015934) (Fig. 3a) and ‘ribosomal subunit’ (GO: 0044391) (Fig. 3b) were found in four comparisons, H167 vs. H74, H167 vs T15, H167 vs U3423, and H74 vs. U3423, both of which satisfied FDR q-val 3d), that satisfied FDR q-val 3). Therefore, pathways that were significant in four of the comparisons, H167 vs. H74, H167 vs. U3423, H74 vs. U3423, H74 vs U6, were also considered. These four comparisons shared a differential gene pathway ‘Phenyalalanine, tyrosine and tryptophan biosynthesis’ (KO00400) (Fig. 3c) that satisfied FDR q-val 2). Figure 3 was a partial display of the GSEA diagram, and the complete GSEA diagram could be found in Figure S11.
Table 3 Common DEG pathways among 5 comparisons in GSEA Fig. 3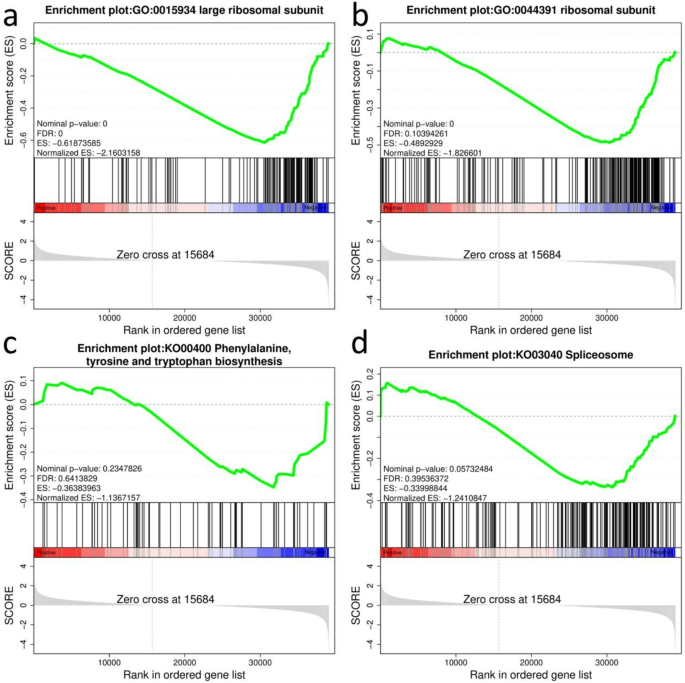
GSEA enrichment score diagram (Note: The manuscript image only shows one comparison, H167 vs. H74. a: GO:0015934; b: GO:0044391; c: KO00400; d: KO03040. Top: from left to right, enrichment scores for each gene, represented as a continuous line. Medium: each line represents a gene in the gene set and its ranking position in the gene list. Below: matrix of gene phenotype association, red is highly expressed in H167, and blue is highly expressed in H74.)
It was interesting to note that by extracting the intersection of the leading-edge subset and GO enriched genes in the two pathways ‘large ribosomal subunit’ (GO:0015934) and ‘ribosomal subunit’ (GO:0044391) obtained by GSEA-GO analysis (Fig. 3), only one gene, ncbi_104422945, could be obtained. It was a high confidence target, and the first Hub gene in this study. Summarizing the results of GO, KEGG, and GSEA enrichment analysis, six gene sets and one Hub gene (ncbi_104422945) related to the genetic mechanism of heterosis growth were identified.
For the three KEGG gene sets, in the ‘Plant-parent interaction’ (KO04626) pathway diagram, it was found that the four comparisons shared the differential gene product CDPK, CaMCML, EDS1,MPK3/6,RPS2 (Table 4). The differences in RPS2 were consistent among the four comparisons. Relative to H167, CDPK and CaMCML in H74 were significantly up-regulated. Compared to H74, CaMCML in U6 showed significant down-regulation, while CDPK showed significant changes (both up-regulated and down-regulation). Compared to H167, there were significant changes (both up-regulated and down-regulation) in CDPK and CaMCML in the parents of H167. This might indicate that they were related to heterosis for growth-related traits. EDS1 expression in the male parents relative to its hybrids was down-regulated, and the EDS1 expression level of H74 was higher than that of H167. Compared to H167, MPK3/6 in U3423 showed a significant up-regulation. The expression level of MPK3/6 of H74 was higher than that of H167 (Figure S12A). In the ‘Phenylalanine, tyrosine and tryptophan biosynthesis’ (KO00400) pathway diagram, it was found that the only common differential gene product among the four comparisons was 2.6.1.5 (enzyme EC number), namely TAT and ARO8 (Table 4). In addition to being up-regulated in the female parent of H74, it was down regulated in the parents of H167, and the expression levels of TAT and ARO8 in H74 were also lower than those in H167 (Figure S12B). In the ‘Splicosome’ (KO03040) pathway diagram, it was found that the only common differential gene product among the five comparisons was the protein complex LSM (Table 4), which was located in the U4/U6 complex. Crucially, the expression level of LSM in H74 parents decreased while the expression level of LSM was higher in H74 relative to H167. This might indicate a strong correlation between LSM expression levels and growth differences. Secondly, according to our priority principle mentioned earlier, the SF3a and eIFA3 proteins shared by the four comparisons might also be particularly critical (Table 4), which were located in the U2 and EJC/TREX complexes, respectively (Figure S12C).
Table 4 Common DEG products among 5 comparisons in 3 KEGG pathway Mutation analysis
The trends of SNP and InDel statistics from RNA editing classification analysis for all samples were almost the same (Figure S13), and mutations would not significantly affect the screening of DEGs in the previous Sect. [23]. There were significant differences in the RNA editing frequencies of the three biological replicates of H74. However, the RNA editing frequency of the other four genotypes remained relatively stable with the change of editing ratio across the three biological replicates showing a normal distribution with a mode of 0.5 (Fig. 4). This might indicate uncertain variations in the modification and processing of post transcriptional mature RNA molecules in the growth disadvantaged hybrid. It might also indicate that dominant growth genes have genetic stability. For future studies, it is recommended that RNA editing frequencies be examined cautiously if in the study has three or fewer biological replicates.
Fig. 4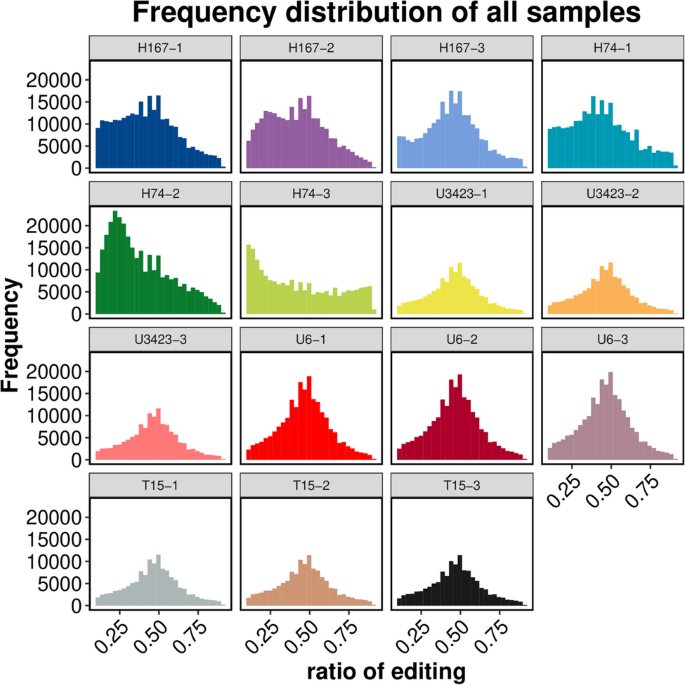
Statistical chart of RNA editing frequency following removal of low-quality SNPs and SNPs near indels
AS analysis
Two hybrids had more AS variants numbers than the parents, and the heterosis might come from AS variants (Figure S14). The JC (the number of Exon Skipping Isoform reads from target and junction sites) between H74 and U6 was the highest, and the number of AS variants of every type was also the highest between these two genotypes. The number of AS variants between H167 and U3423 was generally the lowest (Figure S15A). However, H167 vs. H74 had the lowest JCEC (the number of Exon Inclusion Isoform reads from target and junction sites) (Fig. 5b). Among the 5 comparisons, the two most common event types were SE and RI. The comparisons of H74 vs. U6, H74 vs. U3423, and H167 vs. H74 had the highest number of SEs, followed by RIs. H167 vs. T15 and H167 vs. U3423 had the highest number of RIs, followed by SEs (Fig. 5). These findings might indicate that SEs were related to growth disadvantages, while RIs were more likely to be related to growth advantages. Only H167 vs. H74 (Fig. 5) was shown in the main text, and the rest can be found in the supplementary information (Figure S15).
Fig. 5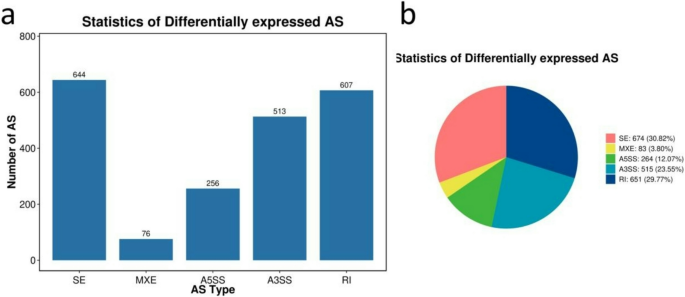
Differential AS classification and quantity statistical diagrams showing the number of differentially expressed genes that contained at least one type of alternative splicing (AS) in H167 vs. H74; a: bar plot showing the number of JC transcripts (i.e., exon-skipping isoforms) with containing a type of AS; b: pie chart showing the number of JCEC transcripts (i.e., exon-inclusion isoforms) containing a type of AS
Compared to the female parent, the correlations between the gene expression levels of the two hybrids and the male parents were stronger (Fig. 1Bb), with fewer differentially expressed genes and greater degrees of difference being observed in between the female parents and their hybrids (Figure S6b-f). The differential regulation of gene products EDS1 and MPK3/6 in the male parent of the superior hybrid H167 and the inferior hybrid H74 was the same (Figure S12A), and the numbers of AS in the male parents and hybrids were higher (Figure S15A). Based on the above results, it was speculated that the male parent had a greater impact on the heterosis of hybrid growth.
WGCNA analysis
Based on the five traits related to eucalypt growth, including HT, DBH, SUR, VOL, and SS, the tan module had the strongest correlation with growth. Except for the SS trait which showed a significant positive correlation with the module, all other traits showed a significant negative correlation with it (p 6). In addition, the grey60 module had a strong correlation with growth, and the positive and negative correlations between the five growth traits and grey60 were consistent with the tan module (p ≤ 0.1) (Fig. 6). The skyblue module had the strongest and most significant negative correlation with HT among all modules (r2=−0.7; p = 0.004) (Fig. 6). It was worth mentioning that this was consistent with our previous research results [9], which suggested that gene expression might have opposing effects on growth quality and SS.
Fig. 6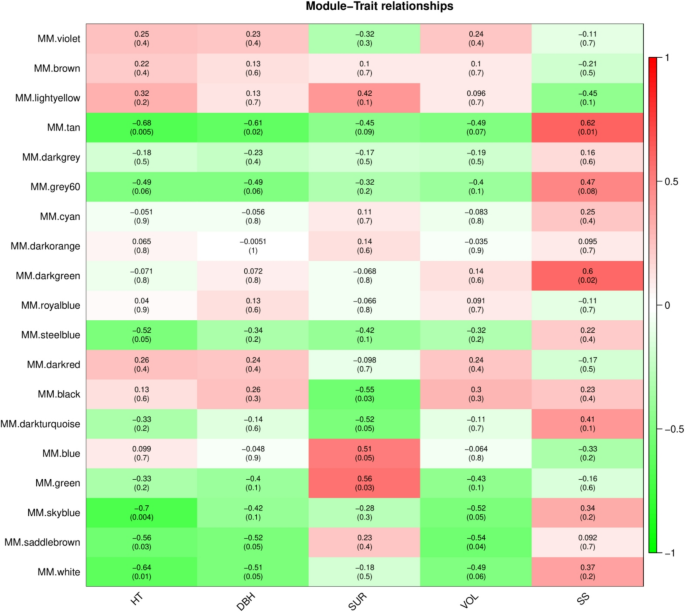
Module trait relation diagram (Note: The horizontal axis represents the trait, and the vertical axis represents the module. The colors of the heatmap correspond to the of Pearson’s correlation coefficients of the modules (the top number in each box) for each trait. Red represents a positive correlation, green represents a negative correlation, darker colors indicate stronger correlations, and the numbers in parentheses below are p-values. The smaller the value, the stronger the significance.)
In the analysis of trait correlation, it was determined that the tan module was highly correlated with growth traits because |GS|>0.8, |Kin|>100, and |MM|>0.9 (Table 5). Accordingly, three hub genes MSTRG.35,350, MSTRG.4104 and ncbi_104443483 were identified (Table 6).
Table 5 Growth trait related genes in the Tan module Table 6 Genes related to growth differences in Eucalypt
Analysis revealed that all five growth traits were positively correlated to varying degrees with Kin and MM values (Figure S16). Two of the most critical growth traits, HT and DBH, were the most strongly correlated with the GS, Kin, MM values. This is important when considering that the vast majority of genes clustered near the eigengenes with the highest GS, Kin, and MM values (Figure S16a-b). This further demonstrated the important biological role of the tan module in the differential growth of eucalypt.
All significantly enriched GO terms in the tan module were biological processes (Figure S17a), which was different from our previous GO enrichment of all differentially expressed genes (Fig. 2). The pathways that were significantly enriched according to KEGG were mostly related to ‘Metabolism’ (Figure S17b). More importantly, the significantly enriched KEGG pathways in the tan module were highly consistent with our previous KEGG enrichment results (Figs. 2b and 3d; Tables 2 and 4; Figure S8B-10B, Figure S11D), where ‘Plant-pathogen interaction’ and ‘Spliceosome’ were present in both enrichments. In addition, the most significant GO enrichment pathway captured in the tan module was ‘Response to endogenouous stimulus’ (Pvalue = 2.2811E-10) (Figure S18a), and the most significant KEGG enrichment pathway was ‘Galactose metabolism’ (Qvalue = 0.006965) (Figure S18b). It was found that relative to H167, the proteins corresponding to 2.4.1.123 and 2.4.1.82 were significantly up-regulated in H74 in the ‘Galactose metabolism’ pathway (Figure S19). Finally, three Hub genes nbci_104448375, nbci_104440165 and nbci_104434572, as well as one transcription factor (TF) nbci_104452186 were identified (Figure S20) (Table 6).
All the genes associated with growth trait heterosis in eucalypt are summarized (Table 6). Moreover, target gene PPI network analysis was used to further determine whether genes that were differentially expressed between the high growth hybrid H167 and the low growth hybrid H74 were associated with heterosis for growth traits in eucalypt. This approach revealed no connectivity between the Hub genes. Therefore, the gene with the highest connectivity (connectivity = 10) was identified from 3 GO pathways (Figure S21a-c) and 3 KEGG pathways (Figure S21d-f) as the final target gene for this study. Only the pathway with the most target genes is displayed in the main text (Fig. 7; Table 7). PPI networks containing the remaining target genes are available in the supplementary information (Figure S21; Table S10-14).
Fig. 7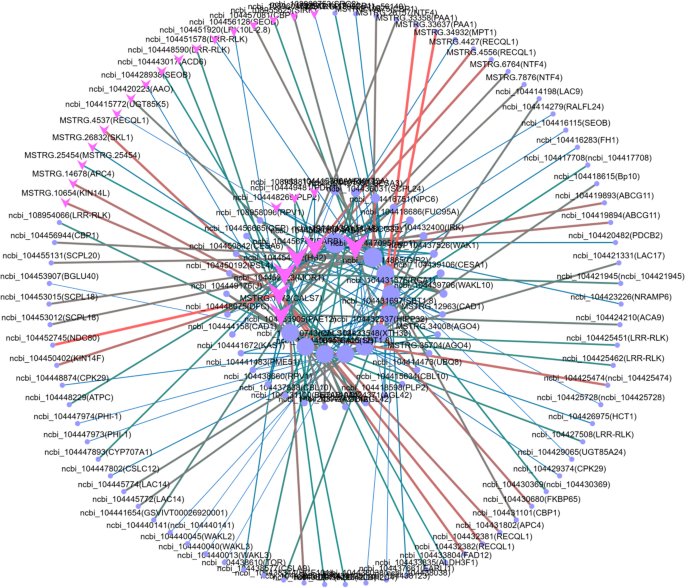
Target gene PPI network (Cell periphery (GO:0071944); Note: The PPI network of other target genes can be found in Figure S21)
Table 7 Target gene PPI network gene overview (Cell periphery (GO:0071944))