The Malus evolutionary genomic landscape
We sequenced accessions from 30 species, de novo assembled high-quality genomes and anchored contigs to chromosomal-scale assemblies (Fig. 1a, Table 1, Supplementary Figs. 1 and 2 and Supplementary Table 1). The assembled Malus genomes contain 53.54–62.38% repetitive sequences (Supplementary Table 2). Long terminal repeat retrotransposons (LTR-RTs) are the most prevalent transposable elements, making up 36.05–49.63% of the assembled genomes, as illustrated by the example of the diploid ‘Golden Delicious’ apple genome (Fig. 1b and Supplementary Table 2). In addition, the Malus genomes were predicted to have an average of 47,106, 82,073 and 89,562 protein-coding genes for the 20 diploid, 4 triploid and 6 tetraploid species, respectively (Table 1). Moreover, our completeness evaluation of the assembled genomes and gene predictions achieved values of the LTR assembly index (LAI) ranging from 14.00 to 22.45 (>20 for 12 genomes; Table 1) and ≥98.5% of Benchmarking Universal Single-Copy Orthologs (BUSCOs) in assemblies and ≥95.8% of BUSCOs in the predicted genes across all species (Table 1).
Fig. 1: The Malus evolutionary landscape based on phylogenomics.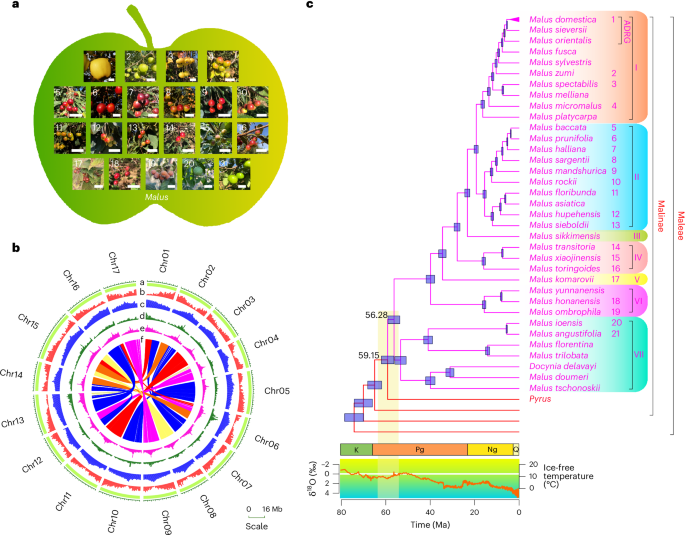
a, The fruit phenotypes of Malus species are highly diverse in size, color and shape. Size bars, 2 cm. Numbers on the photographs are the same as the numbers to the right of the species names in c. b, A Circos plot of the diploid ‘Golden Delicious’ apple genome assembly. Tracks from outer to inner (a to f) are chromosomes, gene density, repeat elements density, LTR/Copia, LTR/Gypsy and syntenic regions between chromosomes. c, A dated phylogenetic tree of Malus simplified from Supplementary Fig. 3. The tree branch length represents the estimated time (the median value) from divergence to the present. Species names are indicated in different colors to the right of terminal branches, with purple for Malus species and red for others in the apple tribe (Maleae). The Malus topology is a summarized phylogeny from phylogenetic analyses using three different gene sets (Supplementary Fig. 3). In Malus, seven clades are designated as I through VII and highlighted with different background colors. Numbers on the nodes represent the divergence times. Horizontal blue bars on each node indicate the 95% confidence intervals of the divergence time in millions of years. The numbers to the right of species are the same as those in a. Stratigraphic periods of Cretaceous (K), Paleogene (Pg), Neogene (Ng) and Quaternary (Q) are illustrated by colored boxes below the tree, based on the ages of their boundaries in the International Chronostratigraphic Chart Capella-Gutiérrez (version 2022/02). The orange curve in the graph below the tree indicates the changes in oxygen isotope records of δ18O (‰), reflecting the temperature changes as indicated by the right axis. The vertical yellow bar indicates the climatic changes during the origination and divergence of Malus. ADRG, apple domestication-related group. Ma, millions of years ago.
Table 1 Summary of haploid consensus genome assembly and annotation
To resolve the phylogenetic relationships among Malus species, we used OrthoFinder40 and HaMStR41 to identify 998 single-copy genes, constructed gene trees and inferred a coalescent species-tree (Methods, Supplementary Fig. 3a and Supplementary Table 3). Within the Malus clade, there are 5 M. domestica accessions, 33 additional Malus species and a closely related species, Docynia delavayi. Our results support a monophyletic Malus (Fig. 1c) with the merge of Docynia into a more broadly circumscribed Malus9,42 (see details and discussions in Supplementary Fig. 3a–c). Our fully resolved Malus phylogeny with high bootstrap (BS) values supports seven Malus clades (I–VII; Fig. 1c and Supplementary Fig. 3). To provide a context of geological times for Malus evolution, we used a Bayesian approach with 12 fossil calibrations (Methods) and found that the estimated age (56.28 (53.60–58.96) Ma) of crown Malus was within the geological period of dramatically changing temperature (Fig. 1c and Supplementary Fig. 3d). Using the new Malus nuclear phylogeny reconstructed here and the geographical distribution of Malus species, we performed a biogeographical reconstruction of the Malus origins (Methods and Supplementary Fig. 4) and found that Malus probably originated in Asia and diversified in Asia during the early history of the genus (from 39.84 to 56.28 Ma).
Clade I contains M. domestica and nine closely related species (Fig. 1c and Supplementary Fig. 3a–c). Within clade I, M. orientalis and M. sieversii are strongly supported as successively sisters to M. domestica, and these three species together form an apple domestication-related group. Clade II contains M. baccata, a common rootstock for grafting apple, and nine relatives. Outside clades I + II, the clades III (M. sikkimensis), IV, V (M. komarovii), VI and VII (Fig. 1c) occupy progressively more distant lineages. The separation of major Malus lineages (for example, the stem lineages of clade III–VI; Fig. 1c and Supplementary Fig. 3d) during decreasing temperatures and subsequent divergence in the cooled climates suggests a likely adaptation of Malus to cooler global environments, consistent with the distribution of Malus species to high altitude and latitude habitat. Biogeographical reconstruction analyses support the idea that the shared ancestor of the North American and European lineages migrated from Asia to a region including the Mediterranean, Europe and the Caucasus (Supplementary Fig. 4). In addition, multiple recent dispersal events led to the spread of several Malus species to North America, northern Eurasia and Africa (Supplementary Fig. 4).
Genome duplications and Malus diversity
To address the uncertainties regarding the phylogenetic position of the WGD detected in the M. domestica genome and by previous phylotranscriptomic analyses10,22,43,44 and to investigate the retention patterns of gene duplications (GDs) during the early history of Malus, we performed phylogenomic analyses (Methods) and placed 6,519 GDs at the most recent common ancestor (MRCA) of Malinae, the subtribe containing Malus and other genera that produce fleshy fruit (node N1; Fig. 2a,b and Supplementary Fig. 5a). Among them, 4,660 GDs have the (AB)(AB) retention type with both duplicates found in both Crataegus pinnatifida and one of the other Malinae lineages (Supplementary Fig. 6), providing strong evidence for a WGD event in the early evolution of Maleae10,22,43,44. Further syntenic support of the early Maleae WGD was obtained with the detection of anchor genes in the newly sequenced Malus genomes (for example, 4,655 of the 4,660 (AB)(AB)-type GDs and 1,852 of the 1,859 (AB)A-type GDs included anchor genes from at least one species; Supplementary Fig. 6). Furthermore, among the 1,852 (AB)A-type GDs with anchor genes, the anchor genes of 1,816 GDs were located in the syntenic blocks that also contain anchor genes corresponding to the GDs of the (AB)(AB) type mapped at Malinae (Supplementary Fig. 6). These results support the idea that most of the GDs in both the (AB)(AB) and (AB)A types were derived from the same WGD mapped to the Malinae MRCA.
Fig. 2: Summary of gene duplications mapped onto the Malus phylogeny.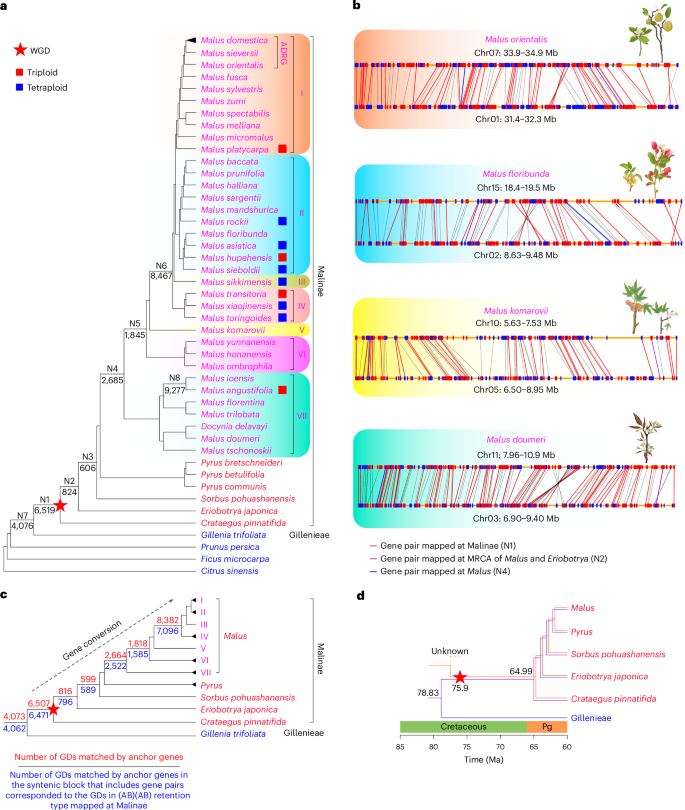
a, The Malus phylogenetic tree with focal clusters of GD events. The left species-tree is a part of that in Supplementary Fig. 3d. Red squares to the right of the species name represent triploids, and blue ones represent tetraploids. GD counts of eight focal GD clusters (N1–N8) are placed below the corresponding branches in the species-tree. Red star indicates an ancient WGD event in the early evolution of the apple tribe. b, Illustrations of chromosomal collinearity (synteny) for gene pairs in four Malus representatives supporting the WGD event. Red and blue rectangles along a yellow line represent protein-coding genes with the transcriptional direction from 3′ to 5′ and 5′ to 3′, respectively. Red lines represent anchor genes with GD mapped at Malinae; purple lines represent anchor genes with GD mapped at the MRCA of Malus and Eriobotrya; blue lines represent anchor genes with GD mapped at Malus. Black lines represent anchor genes either mapped to a node without focal phylogenetic positions or which were not included into gene trees because the focal gene families require more shared species. c, An abbreviated version of the phylogenetic tree shown in a, with clades I–VII represented by individual branches. The red star marks the WGD event in a. The red number above each branch represents the GDs among those shown in a that correspond to syntenic anchor genes present in at least one genome from the species included in the relevant clade. The blue number below each branch represents the number of GDs matching the syntenic anchor genes in those syntenic block(s) that also include gene pairs mapped at Malinae and retained in the (AB)(AB) pattern. Detailed metadata of the number of GDs can be found in Supplementary Figs. 6–12. d, A model of introgression of genes from Gillenieae to the ancestor of Malinae and its descendant lineages. Purple and red branches of Malinae represent the possible subgenomes derived from Gillenieae and the other progenitor, respectively. Ma, millions of years ago.
In addition to the GDs mapped at Malinae, several clusters with ≥500 GDs were mapped at the nodes within Malinae (N2–N6; Fig. 2c and Supplementary Figs. 5–11). To investigate whether these GD bursts represent additional WGD events, we identified the anchor genes that matched these GD bursts, and discovered that 84.7–98.3% GDs mapping at different phylogenetic positions are matched by the Malinae WGD-derived anchor genes in syntenic blocks, strongly supporting the idea that the GD clusters at N2–N6 are GDs from the Malinae WGD (Fig. 2c and Supplementary Figs. 7–11). One explanation for the mapping of GDs from the same syntenic block to later phylogenetic nodes in Malinae could be that the corresponding gene pairs experienced gene conversion at the MRCA of the related clade and became more similar in sequence than the original paralogs (see, for example, ref. 45).
The tribe Gillenieae were hypothesized to be one of the parental lineages of the ancestral Maleae44. We examined the GD distribution for evidence to support this hypothesis and found that 4,076 GDs are mapped at the MRCA of Malinae/Maleae and Gillenieae (Fig. 2a) and include 3,939 GDs branching as ((Malinae/Maleae, Gillenieae), Malinae/Maleae) (Supplementary Fig. 12). This finding suggests that Gillenieae could be a parental lineage, which experienced a hybridization event resulting in the ancestor of Malinae (possibly Maleae) (Fig. 2d). In addition, 3,931 of 3,939 GDs matched anchor genes in the Malinae WGD-related syntenic blocks in one or more of the Malus genomes (Supplementary Fig. 12), supporting the allotetraploidization event resulting from a hybridization between Gillenieae and an unknown lineage. Molecular dating suggested that this WGD event might have contributed to the survival of multiple Malus groups through a decrease in paleo-temperature (Fig. 2d and Supplementary Fig. 5b).
Multiple introgressions in Malus
Hybridization or introgression has often been invoked to explain the detection of topological differences between plastid-based species-trees and nuclear-gene-based species-trees (see, for example, refs. 46,47). Phylogenomic investigation of allopolyploids and their possible progenitors through the reconciliation between numerous nuclear gene trees and the species-tree can provide strong evidence for phylogenetic relationships and evolutionary history between progenitors (and/or close relatives) and their hybrid progeny (and/or its descendants)45. Our newly assembled Malus genomes include four triploids and six tetraploids, providing an opportunity to examine the relationships between genes of different putative subgenomes of the polyploid and those of other Malus species.
We performed phylogenomic and syntenic analyses of 32 Malus genomes and 7 outgroup genomes and detected the Malus orthogroups (MOGs) (Methods). Here we defined the sisterhood relationship between A and B genes in an MOG of a gene tree when A from one hypothesized subgenome of a Malus polyploid is supported (BS ≥ 50) as a sister to B(s) from at least one Malus diploid as a possible progenitor. Among the 20,859 identified MOGs, we detected thousands of sisterhood relationships between A genes and B genes of distinct taxa (a single diploid or a group of diploids) (Fig. 3a and Supplementary Figs. 13–22). Moreover, when the MRCA of a clade containing multiple taxa is considered as a possible progenitor, differential lineage-specific gene loss can lead to the recovery of B genes from a subset of taxa derived from the clade; therefore, we included the number of sisterhood relationships with the B(s) from a subset of taxa in one of clades I–VII (see a in Supplementary Figs. 13–22) in the total number of sisterhood relationships matching the MRCA of the entire clade (see b in Supplementary Figs. 13–22). To further estimate phylogenetic relationships between a polyploid and its possible progenitors, we estimated the number of one or more sisterhoods in one MOG and proposed that the top greatest sisterhood(s) relationships supported candidate progenitors for the Malus polyploid (Fig. 3a and Supplementary Figs. 13–22).
Fig. 3: Analyses of introgression history in Malus.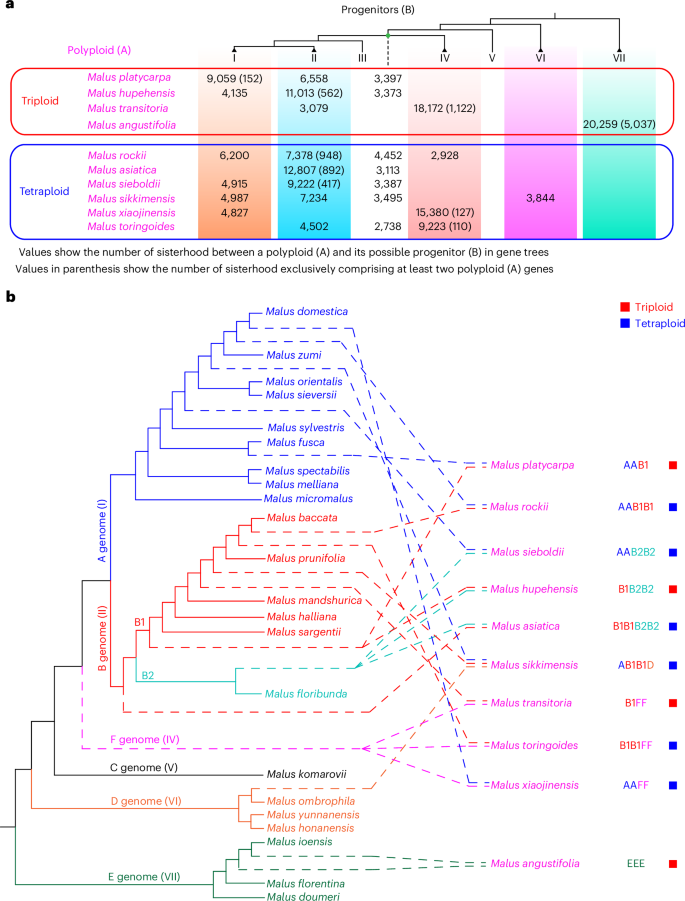
a, A summary of the sisterhood of (A, B) in gene trees of the Malus orthogroup, where A represents the gene from any focal polyploid and is supported (BS ≥50) as sister to B, which represents the gene(s) from a potential progenitor of the polyploid. At the top is a phylogeny of the Malus clades I to VII, derived from the species tree in Fig. 1c. Also in the phylogeny, the dotted line represents the MRCA of clades I to IV, with the numbers below this dotted line for genes from the MRCA of clades I to IV as the potential progenitor. For each of four triploids in the column on the left, up to three numbers are shown below the clade(s) with sisterhood, as support for those clades being potential progenitors. For each of six tetraploids in the left column, up to four numbers are shown below the clade(s) with sisterhood. The number in parenthesis represents the number of gene sisterhoods that have at least two genes from the focal polyploid. The metadata of the sisterhood for each polyploid can be found in Supplementary Figs. 13–22. b, An evolutionary model of the polyploids and their possible progenitors. The phylogeny with diploid species (with branches of solid lines) is derived from the Malus phylogeny; different colors of the lines correspond to different genome types (A–E genomes; their respective clades in Fig. 1c are shown to the right in parenthesis) represented by closely related diploids, as supported by the tree in Supplementary Fig. 23. Dashed lines correspond to the phylogenetic positions of proposed subgenomes of polyploids. Sister groups of the subgenomes represent their possible progenitors (see support values and phylogeny in Supplementary Fig. 23). The red and blue squares on the right indicate triploids and tetraploids, respectively.
The identification of genes of polyploids exhibiting close relationships (sisterhoods) with other Malus taxa provides an opportunity to re-examine the phylogenetic relationships of putative subgenomes of polyploids with the diploids, including the putative progenitors (Fig. 3a). Specifically, we used the phylogeny of diploid Malus species to designate a particular genome type: A through E genomes (Supplementary Fig. 23a). Then the relationships between putative subgenomes of polyploid species and the diploid genomes A–E were analyzed using individual MOG gene trees (Methods), supporting hybridization/introgression events between the A genome and B genome leading to M. platycarpa, M. rockii and M. sieboldii (Supplementary Fig. 23b). Our results also detected introgressions between the species of the B genome (see the B1 and B2 genomic subtypes in Fig. 3b and Supplementary Fig. 23b). In the group with the E genome, our phylogeny and sisterhood analyses supported the diploid M. ioensis as a possible progenitor of the triploid M. angustifolia (see details in Supplementary Figs. 16c and 23b).
Our phylogeny Malus diploid genomes and related polyploid subgenomes supported a sisterhood relationship between two clades: one clade is the MRCA of diploids with A or B genomes as well as the A- or B-related putative subgenomes of polyploids; the other clade is the MRCA of a putative subgenome (F-related genome) of each of three polyploids (including two subgenomes in each of a triploid M. transitoria and two tetraploids, M. toringoides and M. xiaojinensis) (Fig. 3b and Supplementary Fig. 23b). This result suggests that these three polyploid species probably shared a common (tetraploid) progenitor that originated before the divergence of the A and B genomes and after the split of the C genome from the A and B genomes. Our phylogeny also supported species with the D genome (or its close relative) as one possible parent for the tetraploid M. sikkimensis (Fig. 3b and Supplementary Fig. 23b). The E genome was supported as a sister to other Malus species (Fig. 3b and Supplementary Fig. 23b). In general, our results provide a detailed phylogenetic relationship among diploid and (some of) the subgenomes of polyploid Malus species and support a model for the history of the Malus genome evolution with proposed progenitors and their polyploid descendants and implications for genome evolution and apple breeding.
Malus pan-genome and structural variation
To investigate the genetic diversity of the Malus genomes, we assembled haplotype-resolved (phased) genomes for all 20 diploid species and achieved total sizes of 1.18–1.48 Gb, which were approximately twice the size of the haploid consensus genomes (Supplementary Table 4). BUSCO analyses supported 98.8–99.3% completeness of the 1,614 single-copy Embryophyta genes in the 20 phased diploid assemblies (Supplementary Table 4).
We first detected SVs by comparing 52 haplotype-resolved assemblies from 26 diploid accessions (20 from this study and 6 from previous studies30,39) and the consensus assemblies from 10 polyploid accessions to the ‘Fuji’ consensus genome39. The SVs are dispersed throughout euchromatic regions, and the SV density can be elevated around centromeric regions on certain chromosomes (Fig. 4a). Of the SVs, 33.62% were distributed in intergenic regions (Supplementary Fig. 24a,b). We identified 468,006 presence–absence variations (267,667 insertions and 200,339 deletions; ≥50 bp), 2,591 duplications and 1,990 inversions (Fig. 4b). The presence–absence variations had an accumulated length of 1.62 Gb and accounted for 96.58% of all variations. We found a total of 34,930 SVs shared by all seven clades in the Malus species tree (Fig. 4c), with only 18.52% located in intergenic regions (Supplementary Fig. 24c). The total number of SVs increased when additional genomes were added and eventually plateaued, suggesting that the vast majority of SVs in the Malus genus have been captured (Fig. 4d). Further analysis revealed that 88.54% of these SVs consist of repetitive sequences, mainly LTR-RTs (Supplementary Fig. 25), suggesting that transposable elements probably drive SV formation in Malus genomes.
Fig. 4: Genetic SVs of Malus pan-genome.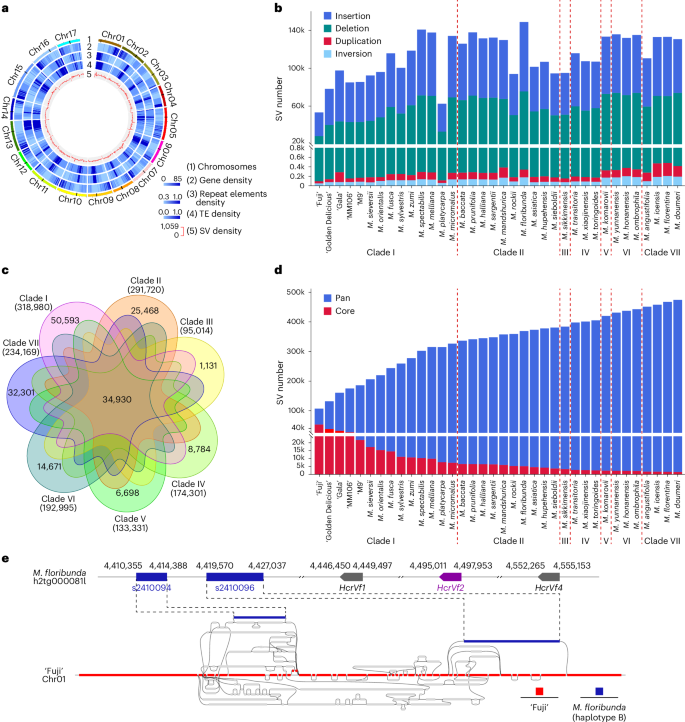
a, A Circos plot of the ‘Fuji’ genome with genomic features. From outer to inner tracks: (1–4) chromosomes, gene density, repeat elements density and transposable element (TE) density of ‘Fuji’ genome; (5) density distribution of pan-SV features detected from 36 Malus accessions, which were combined and showcased in a pan-Malus SV set. The potential centromeric regions on each chromosome are depicted as black bars on track 1. b, The composition of SVs in each Malus accession. c, A seven-way Venn diagram showing shared and clade-specific SVs. Each clade is presented by a distinct color, and the numbers within the colored sections indicate the count of SVs specific to that clade. The number in parentheses under each clade represents the total number of detected SVs in that clade (observed in at least one haplotype of one accession in the clade). A total of 34,930 SVs are commonly detected in all seven clades. d, Trend of core- and pan-SVs; the SVs called from additional accessions in the listed order were added iteratively. e, Schematic diagram of pan-genome graph paths at the Rvi6 region of M. floribunda haplotig. Red represents the backbone reference genome. Alternative paths are shown in gray. M. floribunda-specific segments are shown in blue. The position and orientation of the HcrVf2 gene are indicated in purple.
Pan-genome graphs have the power to uncover SVs that may not be captured by traditional linear comparative genomics methods48,49. To further explore the genetic diversity of the Malus pan-genome, we constructed a pan-Malus genome graph containing 3.15 million segments with an accumulated length of 3.18 Gb, including 1.83 million nonreference segments (unaligned to the ‘Fuji’ reference genome) of 2.45 Gb (76.85% of total). Overall, 117,246 SVs were detected using this graph-based approach (see Methods for the definition of SVs), which were categorized into four types: insertion (31,989), deletion (21,969), divergent (9,577) and multi-allelic (53,711) (Supplementary Fig. 24d). A detailed characterization of accession-specific segments or SVs may provide important guidance for the genetic study of desirable agronomic traits. For instance, apple scab is one of the most serious diseases all over the world50. M. floribunda has been extensively utilized in scab resistance breeding51. In particular, two M. floribunda-specific segments (s2410094 and s2410096) were identified in the Rvi6 region, a scab resistance locus that contains the HcrVf2 gene (Mfloribunda-hap2_g48469) conferring scab resistance51,52 (Fig. 4e). Notably, the two segments were present in only one haplotype of the phased diploid genome of M. floribunda and were absent in the haploid consensus genome, highlighting the advantages of using phased haplotype-resolved assemblies to better understand the functional and structural diversity of Malus genomes. We examined the presence of one M. floribunda-specific segment, s2410094 (SCAB-R), in 16 scab-resistant cultivars derived from crosses with M. floribunda. All 16 cultivars were found to carry the SCAB-R segment, indicating a strong co-segregation between SCAB-R and scab resistance (Supplementary Fig. 26). This finding suggests that SCAB-R could be effectively used in marker-assisted selection of scab resistance, particularly when the resistance trait segregates among progenies involving crosses with M. floribunda as a parental stock.
Pan-genome graph tool captures selective sweeps for traits
Utilizing diverse genomes in selective sweep analyses can minimize the impacts of genome-specific biases and enhance the detection of sweeps that could be missed with a single reference genome. Here, we developed IntervalConvertor, a tool that converts the selective sweep regions detected from different reference genomes to a standard genome coordinate using the pan-genome graph, allowing comparisons and reconciliations of sweeps from various genome sources in a consistent and uniform manner (Supplementary Fig. 27).
The resequencing data for 337 accessions (247 domesticated apple accessions and 90 wild accessions) were collected for selective sweep analyses to identify genomic regions under selection during apple domestication7,8,30,53 (Supplementary Table 5). We utilized five genome assemblies as references, including two cultivars (‘Fuji’ and ‘Golden Delicious’) and three wild relatives (M. sieversii, M. micromalus and M. prunifolia). On the basis of the pan-genome graph, our tool IntervalConvertor converted genomic regions identified from the other four reference accessions to the ‘Fuji’ genome coordinates. This enabled the identification of selective sweeps and associated genes specific to each assembly (Supplementary Fig. 28a,b), which illustrated that using a single reference genome has limitations in capturing genetic diversity.
Accessions of wild species could exhibit advantages over domesticated accessions in cold tolerance and defense against pathogen invasions. Among those assembly-specific selective sweep regions, we found the MdMYB5 gene located in one region that could only be detected when using M. prunifolia or M. micromalus as the reference genome (Fig. 5a). The MYB transcription factors have been shown to mainly regulate the biosynthesis of secondary metabolites, which play key roles in plant stress resistance54. When tested in 46 Malus accessions, significantly higher expression of MdMYB5 was observed in wild accessions than in domesticated accessions (Fig. 5b and Supplementary Table 6). One SNP located 260 bp upstream of the ATG start codon of MdMYB5 was identified to have the C (cytosine) allele instead of T (thymine), with a frequency of homozygous (C/C) being 42.22% in 90 wild accessions but with a relative low frequency of 0.81% in 247 domesticated accessions. To further investigate the impacts of the SNP on MdMYB5 expression, we transformed apple calli with MdMYB5Cpro::GUS and MdMYB5Tpro::GUS. The β-glucuronidase (GUS) activity of MdMYB5Cpro::GUS was much higher than that of MdMYB5Tpro::GUS (Fig. 5c). The repressive histone mark H3K27me3 was significantly more enriched in the promoter region of MdMYB5 in domesticated apple accessions with the T/T genotype, compared with wild accessions with the C/C genotype (Supplementary Fig. 28c and Supplementary Table 7). As H3K27me3 is typically associated with gene silencing, this enrichment in domesticated apples aligns with the observed lower expression of MdMYB5. These findings reflect a selection pressure on MdMYB5 during apple domestication, and the identified SNP might be a functional polymorphism related to the variation of MdMYB5 expression.
Fig. 5: MdMYB5 was under selection pressure during apple domestication and promoted both biotic and abiotic stress tolerances.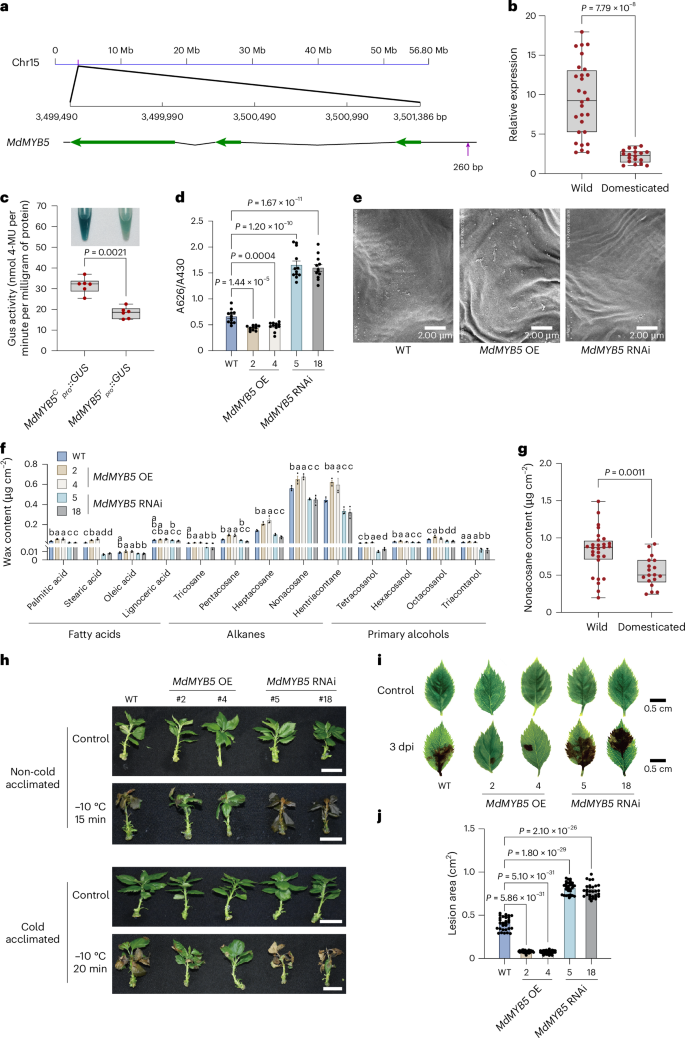
a, The location of MdMYB5 in the ‘Fuji’ genome. The green arrows show protein-coding sequences. The purple arrow indicates the SNP associated with the expression of MdMYB5. b, The relative expression levels of MdMYB5 in wild and domesticated apple accessions (n = 28 and 18, respectively). c, The GUS activity analysis of transgenic apple calli carrying MdMYB5Cpro::GUS or MdMYB5Tpro::GUS (n = 6 independent experiments). d, Quantification of TB staining. The TB absorbance (A626) is normalized by chlorophyll absorbance (A430) (n = 12 independent experiments). e, SEM images of leaf cuticular wax crystals from 1-month-old WT, MdMYB5 OE and RNAi plants. Images are representatives of three independent experiments across three apple plants with similar results. Scale bars, 2 μm. f, Leaf cuticular wax compositions and contents of WT, MdMYB5 OE and RNAi plants. Leaves were harvested from 1-month-old tissue-cultured plants (n = 3 independent experiments). The P values are listed in Supplementary Table 8. g, The leaf nonacosane (C29 alkane) content in wild and domesticated apple accessions (n = 28 and 18, respectively). h, Freezing tolerance performance of WT, MdMYB5 OE and RNAi plants with or without cold acclimation. Plants were photographed 5 days after recovery. Scale bars, 2.5 cm. i, Disease symptoms of WT, MdMYB5 OE and RNAi leaves. dpi, days post-infection with Alternaria alternata. Scale bars, 0.5 cm. j, Quantification analysis of the lesion area for the leaves in i (n = 30 independently collected leaves from different plants). Error bars represent the standard error on the mean (s.e.m.). WT, wild-type GL-3. For b–d, g and j, P values were determined using a two-tailed Student’s t-test. For f, one-way analysis of variance (ANOVA) (Tukey’s test) was performed for each group. Different letters indicate significant differences (P b, c and g, the center line indicates a median value, the lower and upper hinges represent the 25th and 75th percentiles and the whiskers extend to the minimum and maximum values.
To study MdMYB5 function, we generated MdMYB5 overexpression (OE) apple lines 2 and 4 with 31- and 28-fold increase in expression and RNA interference (RNAi) lines 5 and 18 with 85% and 71% reduction in the background of GL-3, respectively (Supplementary Fig. 28d,e). Owing to the close association between cuticular wax and the permeability of leaf surfaces55, we first used Toluidine Blue (TB) staining to assess the cuticular permeability in MdMYB5 OE and RNAi plants. The results revealed that MdMYB5 OE plants exhibited significantly less TB staining compared with nontransgenic plants and MdMYB5 RNAi plants, indicating that MdMYB5 may alter cuticular permeability (Fig. 5d). We used scanning electron microscopy (SEM) to examine the crystals of cuticular wax and observed a higher density of wax crystals in MdMYB5 OE plants and a reduced density of wax crystals in MdMYB5 RNAi plants than in the nontransgenic GL-3 (Fig. 5e). Further investigation of wax composition using gas chromatography-tandem mass spectrometry (GC-MS) analysis revealed similar changes to those of the wax crystals (Fig. 5f and Supplementary Table 8). Nonacosane (C29 alkane) was one of the most abundant components of cuticular wax56. When analyzing C29 alkane in 46 apple accessions, we found significantly higher contents in wild accessions than in domesticated accessions (Fig. 5g). Therefore, the domestication process could have selected a MdMYB5 allele that caused notably decreased cuticular wax biosynthesis.
Cuticular wax on the surface of plants provides essential protection of plants against both biotic and abiotic stresses57,58. We first conducted freezing tolerance assays using MdMYB5 OE and RNAi transgenic plants. Compared with the nontransgenic GL-3 plants, MdMYB5 OE lines showed increased tolerance to low-temperature stress. In contrast, MdMYB5 RNAi plants exhibited more severe damage than the nontransgenic plants (Fig. 5h). These results indicate that MdMYB5 positively regulates freezing tolerance in apple. To further evaluate the biological function of MdMYB5 against pathogen attack, we infected detached leaves with Alternaria alternata (the causal agent for Alternaria blotch disease in apple)59. After 3 days, the MdMYB5 OE plants showed a smaller lesion area than the nontransgenic plants. Conversely, the MdMYB5 RNAi plants had the largest lesion area, indicating that MdMYB5 plays a positive role in resistance of apple to A. alternata infection (Fig. 5i,j). Therefore, the lower expression of MdMYB5 observed in domesticated accessions, compared with wild accessions, might be a cause of the weakened stress tolerance during the domestication process54,58,60. Collectively, the pan-genome graph created in this study, along with the newly developed bioinformatics pipeline, greatly facilitates the utilization of additional reference Malus genomes in genome-wide association study or selective sweep analysis, and thus largely increase the efficiency of genetic studies of key agronomy traits.