
Human fat depot-specific adipocyte atlases
To generate hSAT and hVAT depot-specific human adipocyte atlases, we performed single-nucleus RNA sequencing (snRNA-seq) on five hSAT–hVAT paired samples and five additional samples of hVAT. Samples were donated by a relatively healthy cohort of men (20%) and women (80%) undergoing elective abdominal surgeries, with diverse body mass indices (BMIs; 23.8–44.1 kg m−2), ages (24.5–53.4 years) and backgrounds (Methods and Fig. 1a). A total of 37,879 hSAT nuclei and 83,731 hVAT nuclei passed quality control scrutiny (Methods and Supplementary Table 1) and underwent depot-separate clustering based on their nuclear RNA repertoires. Adipocytes were easily identified in both hSAT and hVAT by expressing adiponectin (ADIPOQ) and additional adipocyte markers AQP7, LPL and PLIN1 (Fig. 1b,c). Moreover, genes overexpressed in adipocyte clusters (>2-fold versus all other depot’s nuclei, adjusted P (Padj) 1), were enriched for pathways of fatty acid and lipid metabolism, fitting with adipocytic characteristics (Supplementary Table 2).
Fig. 1: Single-nuclei atlases of hSAT and hVAT.
a, Clinical characteristics of the 15 samples used to build the atlases. Samples were collected from female and male donors with varying age and BMIs, as described in the pie charts. Characteristics were measured directly or extracted from donors’ medical records. b, The expression of the adipocyte marker adiponectin (ADIPOQ) in Uniform Manifold Approximation and Projection (UMAP) representations of hSAT and hVAT snRNA-seq atlases containing 37,879 and 83,731 nuclei, respectively. In both depots, adipocytes constitute a well-defined cluster. c, The expression of cell-specific markers in different clusters of each depot. Adipocytes were distinguished by multiple markers (marked in orange). d, The fraction of adipocytes per depot, stratified by sex, age and BMI in the snRNA-seq in-house data (hSAT, hVAT) and on estimating adipocyte proportions using deconvolution (Decon.) analysis of 73 paired bulk RNA-seq profiles (‘Decon’; hSAT:hVAT). Adipocytes were significantly more prevalent in hSAT versus hVAT in both datasets (two-sided Mann–Whitney U-test P = 0.0013 and P = 1.205 × 10⁻¹³, respectively), and tended to be more prevalent in females versus males according to the snRNA-seq data (two-sided Mann–Whitney U-test P = 0.044 in hVAT only). Other differences were not statistically significant. The boxplot central band indicates the median, the box limits the 25th to 75th percentiles and the whiskers 1.5× the interquartile range.
Overall, we identified 12,205 (32.2%) hSAT and 15,460 (18.5% of total) hVAT adipocytes. Adipocytes were more abundant in women than in men in both fat depots and more frequent in hSAT than hVAT, potentially owing to the lower cellular diversity of hSAT (10 cell types, versus 13 in hVAT; Fig. 1d and Supplementary Table 1). These results were corroborated on analyzing our paired hSAT–hVAT samples alone (Supplementary Fig. 1). The larger frequency of adipocytes in hSAT versus hVAT was supported when applying sNucConv—a deconvolution tool tailored for snRNA-seq of adipose tissue16—onto paired hSAT/hVAT bulk RNA-seq data of 73 patients with extreme obesity (Fig. 1d).
To further compare adipocyte populations between depots we applied pseudobulk analysis, followed by differential gene expression between depots (Methods). The hVAT adipocytes were, as expected, enriched for pathways such as insulin resistance (Padj = 0.007), inflammatory mediator regulation of the transient receptor potential channel (Padj = 0.005), adipocytokine signaling pathway (Padj = 0.016) and circadian entrainment (Padj = 0.031; Supplementary Data 2).
We next investigated the diversity of the adipocyte population per depot by subclustering adipocytes based on their snRNA-seq profiles. This analysis revealed seven and eight clusters of hSAT and hVAT adipocytes, which we denoted SA1–7 and VA1–8, respectively (Fig. 2a). Each adipocyte cluster contained nuclei from all samples (Supplementary Table 3 and Supplementary Fig. 2a) and similarly expressed markers of mature (terminally differentiated) adipocytes (ADIPOQ, AQP7, LPL and PLIN1; Fig. 2b). In addition, each adipocyte cluster overexpressed at least 20 genes compared with all other adipocyte clusters (Supplementary Figs. 3 and 4 and Supplementary Data 3), although the degree of overexpression varied (Fig. 2c). For example, the 20 topmost overexpressed genes in the largest cluster per depot, SA1 and VA1 (85% and 75% of the adipocyte nuclei in hSAT and hVAT, respectively), were only modestly overexpressed relative to the 20 topmost overexpressed genes of other clusters (for clarity, Fig. 2c presents only a randomly selected subset of SA1 or VA1).
Fig. 2: Adipocyte-specific atlases of hSAT and hVAT.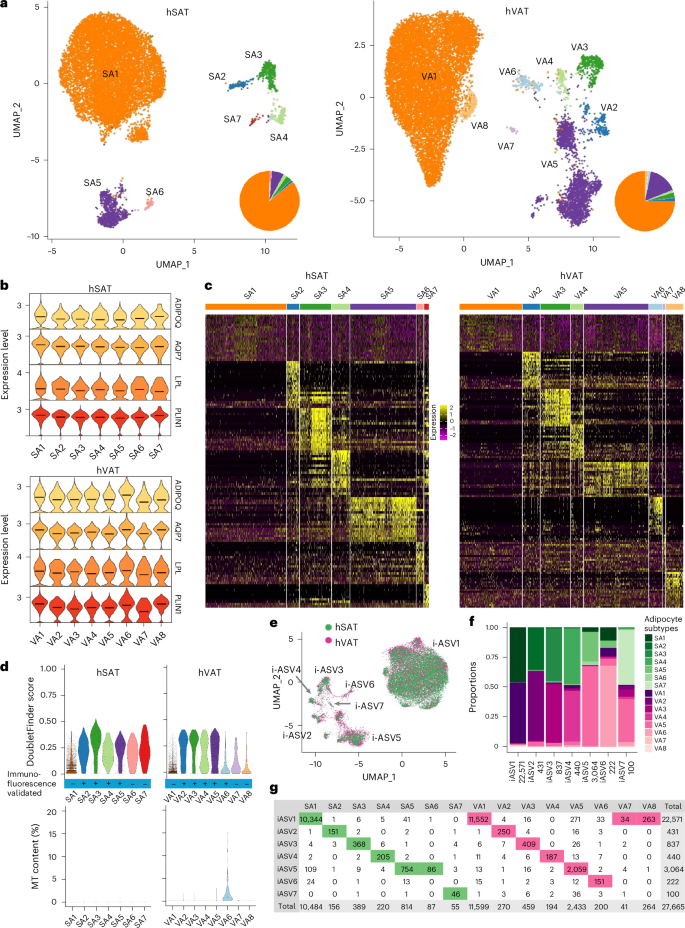
a, UMAP representations of hSAT and hVAT adipocyte atlases containing 12,205 and 15,460 nuclei, respectively. Pie charts show the relative abundance of each adipocyte subset. b, The expression of adipocyte markers in adipocyte clusters of each depot. Distinct clusters expressed markers at similar levels. c, Heatmaps based on the top 20 markers of each adipocyte cluster in hSAT and hVAT. Adipocyte clusters are represented by all their nuclei (columns), except for SA1 and VA1 which are represented by a randomly selected subset of nuclei as a result of their large size. d, Violin plots depicting below-threshold DoubletFinder score (upper) and mitochondrial (MT) content (lower) per adipocyte cluster. Clusters that were validated by immunofluorescence (Fig. 5) were marked with ‘+’. e, UMAP representation of the integrated hSAT and hVAT adipocyte atlases, showing that most subsets overlap between the two depots. f, The proportions of SA1–7 and VA1–8 in each iASV1–7 cluster. The total number of nuclei per integrated cluster appears below the cluster name. g, The number of nuclei from SA1–7 and VA1–8 (columns) that contribute to each integrated cluster (rows). Per column, the entry corresponding to the maximal value (that is, most nuclei) is highlighted.
All adipocyte nuclei passed stringent quality control assessment (detailed in Methods). Yet, when assessing each adipocyte cluster’s subthreshold doublet score, SA2–7 and VA2–5 had higher score distribution compared with SA1 or VA1, and VA6 had a higher mitochondrial gene content (Fig. 2d). To further support the validity of our adipocyte subclusters, we reanalyzed the raw snRNA-seq data using two alternative computational pipelines with enhanced doublet or ambient RNA removal (Supplementary Note). Subclustering of the identified adipocytes showed that adipocyte clusters were retained in both pipelines, mostly as distinct clusters (Supplementary Figs. 5 and 6).
To compare hSAT and hVAT adipocyte landscapes, we combined our depot-specific datasets, reclustered them into depot-integrated adipocyte clusters and assessed the composition of each integrated cluster (denoted ‘integrated adipocytes subcutaneous and visceral‘ (iASV); Fig. 2e and Supplementary Table 4a). Notably, SA1–5 and VA1–5 contributed to iASV1–5, respectively, demonstrating the similarity in adipocyte subpopulations of the two depots. For example, >98% of SA1 nuclei and >99% of VA1 nuclei clustered together into iASV1 (Fig. 2f,g). We also observed depot differences, because iASV6 was contributed predominantly by VA6 (68% of iASV6 cells).
Characterizing adipocyte subpopulations
To infer the putative functions of the different adipocyte clusters, we subjected SA1–7 and VA1–8 separately to functional enrichment analysis, based on their differential expression profiles relative to other adipocyte clusters in the same depot (Methods, Supplementary Data 4 and Fig. 3). In both depots, SA1 and VA1 clusters were enriched for fatty acid and lipid metabolic processes and were therefore denoted as ‘classical adipocytes’ (Fig. 3b). Their classical adipocytic functions, relatively common to all adipocyte clusters, explain their modest overexpression pattern observed in Fig. 2c. Most of the remaining clusters were enriched for nonclassical adipocyte functions: ‘angiogenic adipocytes’ (SA2,VA2) were enriched for angiogenesis, blood vessel and vascular development processes (Fig. 3c). ‘Immune-related adipocytes’ (SA3,VA3) were enriched for immune-regulation processes, such as ‘positive regulation of phagocytosis’ and ‘macrophage activation’ (Fig. 3d). Additional immune-related adipocytes (SA4,VA4) were also enriched for lymphocytic processes, including ‘T cell activation’ and ‘adaptive immune response’ and were thus named ‘immune-related (adaptive) adipocytes’ (Fig. 3e). ‘Extracellular matrix (ECM) adipocytes’ (SA5,VA5), were enriched for ECM processes, including ‘ECM structural constituent’ and ‘ECM organization’ (Fig. 3f). The depot-specific cluster VA6 was enriched in mitochondrial and ribosomal genes and processes (for example, ‘mitochondrion organization’, ‘mitochondrial respiratory chain complex I assembly’, ‘ribosomal subunits’, ‘protein targeting to endoplasmic reticulum’, Supplementary Data 4) and were thereby termed ‘mito-ribosomal adipocytes’ (Fig. 3g). Clusters SA6–7 in hSAT and VA7–8 in hVAT, which contained small numbers of nuclei, were not significantly enriched for specific processes and remained unannotated. Given the SA1/VA1 distinction from the remaining adipocyte clusters, we collectively named the latter ‘nonclassical adipocytes’.
Fig. 3: Characterization of adipocyte clusters of hSAT and hVAT.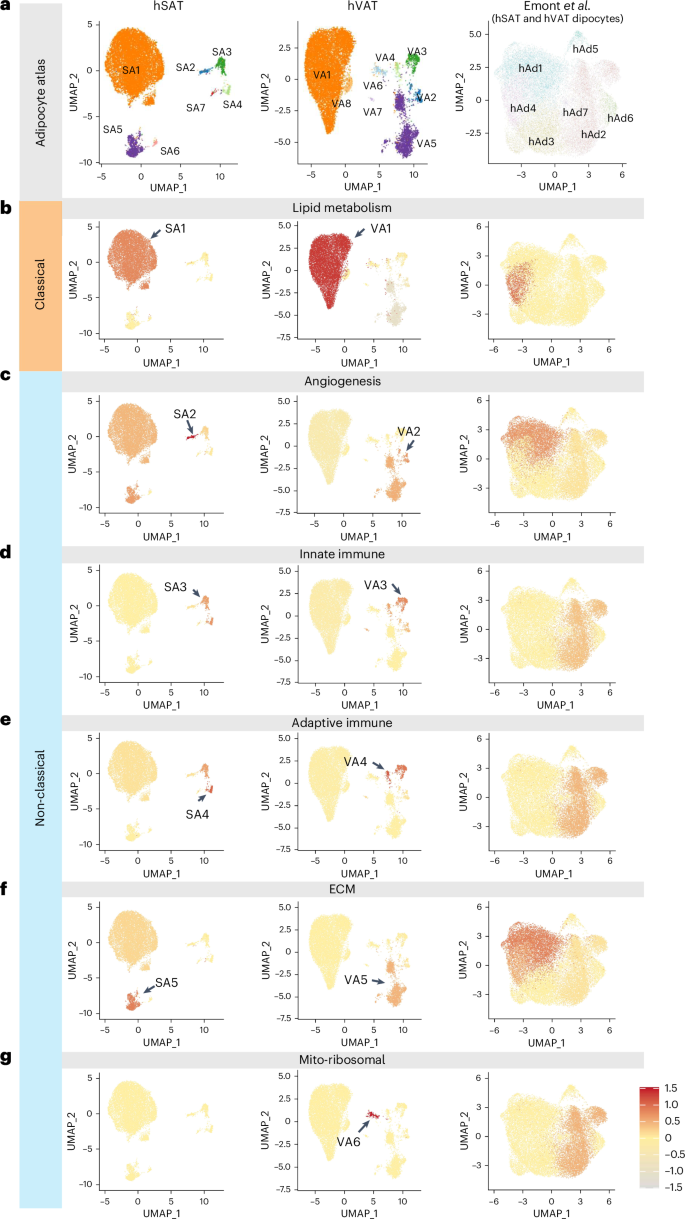
a, UMAP representations of the in-house hSAT and hVAT adipocyte atlases and the combined hSAT and hVAT adipocyte atlas of Emont et al.9. Each UMAP is colored by the adipocyte subtypes defined herein (for hSAT and hVAT) or by Emont et al. (right). b–g, UMAP representations of hSAT, hVAT and Emont et al. adipocyte atlases: lipid metabolism (b); angiogenesis (c); innate immune (d); adaptive immune (e); ECM (f); and mito-ribosomal (g). Each cluster is colored by its mean normalized enrichment scores (NES) for GO annotations related to the process specified in the panel (see color legend at bottom right). Adipocyte subtypes were enriched for distinct processes, suggesting that they have different functionalities.
We next searched for potentially active regulons (transcription factors and their target genes) per adipocyte subtype using SCENIC17 (Methods, Supplementary Table 5 and Fig. 4a). Certain regulons were active in all adipocyte subtypes, including key adipogenesis transcription factors (ATF2, CEBPB), consistent with the similar expression of fully differentiated adipocyte markers in all adipocyte subtypes from both depots (Fig. 2b). Depot differences were also noted. For example, CEBPA regulon was identified in VA1–8, but not in hSAT adipocyte subtypes. Other regulons were unique to the different nonclassical adipocyte subtypes in both depots, some supporting the putative adipocyte subtype functions. For example, PRRX1, which characterized the ECM subtype VA5, is known to regulate transforming growth factor-β (TGFB)-mediated fibroblast-to-myofibroblast differentiation, fibroblastic phenotype of adipocytes18 and expression of COL6A3 (ref. 19). Likewise, MEF2C and the nuclear factor-κB-subunit RELB characterized the immune subtypes in both depots (SA3–4, VA3–4). Some regulons, occasionally of the same family of transcription factors, were depot specific: of the cytokine-response STAT family, STAT4 characterized SA4 whereas STAT6 characterized VA4. Jointly, the regulon analysis provided a depot similar and differential regulatory network view, supporting the putative functionality of nonclassical adipocytes.
Fig. 4: Further characterization of adipocyte clusters of hSAT and hVAT.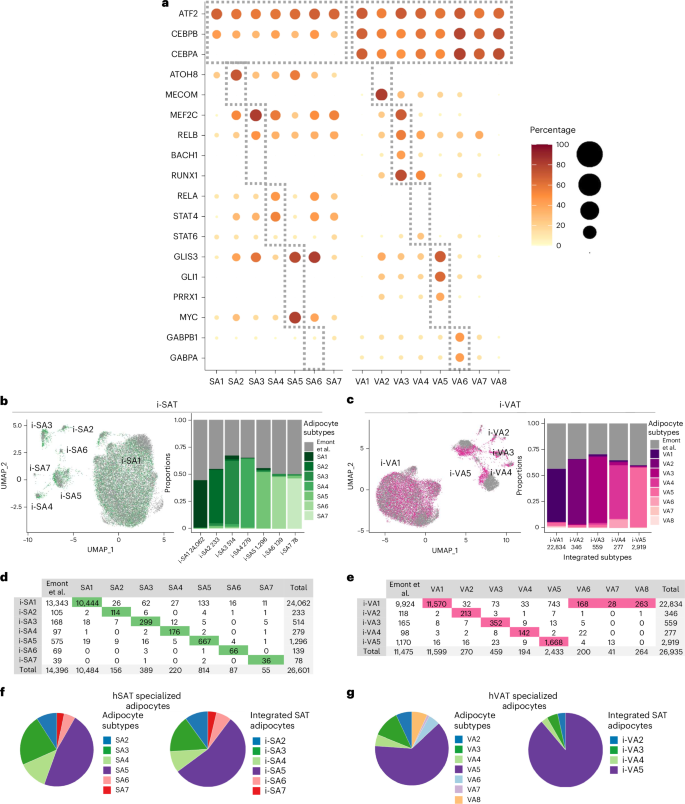
a, Potentially active regulons (rows) within adipocyte subtypes (columns). The regulons were named by their transcription factor; circle size and color intensity indicate the percentage of nuclei with a potentially active regulon. The gray boxes mark all adipocyte subtypes (top box) or specific subtypes. b,c, UMAP representations of the integration of our in-house adipocyte atlases (green, hSAT; pink, hVAT) and the atlases of Emont et al.9 (gray): i-SAT (b) and i-VAT (c). The proportions of SA1–7 and VA1–8 in each integrated SAT (i-SA1–7) or VAT (i-VA1–5) cluster are depicted in the bar plots. The total number of nuclei per integrated cluster appears below the cluster name. d,e. The number of nuclei (columns) from SA1–7 (d) or VA1–8 (e) and Emont et al. that contribute to each integrated cluster (rows). Per column, the entry corresponding to the maximal value (that is, most nuclei) is highlighted. f, The similar distribution of nuclei among nonclassical adipocyte clusters for the in-house dataset (SA2–7, left) and the Emont et al. atlas (i-SA2–7). g, Same as f, for hVAT (VA2–8, i-VA2–5).
Last, we tested whether nonclassical adipocytes were present in other atlases and datasets of human adipose tissues. We first focused on the atlas of Emont et al.9, which contained 14,396 hSAT and 11,475 hVAT adipocytes. To assess the similarity among adipocytes of each atlas, we integrated them separately for hSAT and hVAT and assessed the composition of each integrated cluster (i-SA in SAT, i-VA in VAT; Fig. 4b–g, Supplementary Table 4b,c and Supplementary Fig. 7). In hSAT, we identified seven integrated clusters (Fig. 4b). Although Emont et al. contributed more hSAT adipocytes than our in-house data, i-SA1–7 reassuringly matched our in-house clusters SA1–7 (Fig. 4d). Most (92.7%) of the Emont et al. adipocytes appeared in the integrated classical adipocyte i-SA1 cluster. The remaining adipocytes (7.3%) segregated into each of the remaining integrated clusters, with each cluster containing ten to hundreds of nuclei distributed similarly to our in-house data (Fig. 4d,f and Supplementary Table 4b). In hVAT, we identified five integrated clusters (i-VA1–5) that matched our in-house clusters VA1–5 (Fig. 4c; the small VA6–8 were integrated into i-VA1). As in hSAT, most (86.5%) hVAT adipocytes of Emont et al. appeared in the classical i-VA1 cluster, whereas the remaining 13.5% split into each of the other nonclassical adipocyte clusters (Fig. 4e,g and Supplementary Table 4c). A similar view was obtained with riverplots of the two atlases (Supplementary Fig. 8). As an additional test for the existence of nonclassical adipocytes in Emont et al.’s atlas, we trained subtype-specific classifiers on our in-house adipocyte subtypes and applied them to Emont et al.’s adipocytes (Methods and Supplementary Fig. 9a). This analysis also revealed considerable fractions of nonclassical adipocytes per depot (Supplementary Fig. 9b and Supplementary Table 6). Last, functional enrichment analysis of Emont et al.9 adipocyte clusters hAd1–7 showed enrichment for the nonclassical adipocyte functions (Supplementary Data 4 and Fig. 3c–g).
The presence of nonclassical adipocytes was also observed in the hSAT spatial transcriptomics dataset of Backdahl et al.11 and on applying sNucConv deconvolution16 to the 73 paired hSAT/hVAT bulk RNA-seq profiles, at expected proportions (Supplementary Note and Supplementary Figs. 9c and 10). Thus, multiple computational analyses and datasets support the presence of classical and nonclassical adipocytes in hSAT and hVAT.
Microscopic detection of nonclassical adipocytes
Next, nonclassical adipocytes were validated directly at the protein level in histological sections of human adipose tissues. We chose PTPRB, PDE4D, SKAP1 and ANK2 as markers to identify SA2–5/VA2–5, respectively (Methods and Fig. 5a–d). As each marker was also expressed in nonadipocyte cell types (Extended Data Fig. 1), we also stained for the adipocyte protein perilipin 1 (PLIN1). Immunofluorescence analyses were performed on paraffin sections of hSAT and hVAT using marker-specific commercial antibodies (Supplementary Table 7). To ensure specificity of the fluorescent signal, each antibody was first tested on a positive control tissue. Fluorescence emission spectra from these stained sections were comparable to positive signals from stained adipose tissue, as were nonprimary antibody negative controls (Extended Data Fig. 2). Nonclassical adipocytes identified as being PLIN1 plus subtype-specific, double-positive markers were identified, confirming the presence of SA2–5/VA2–5 within hSAT and hVAT (Fig. 5e–h and Extended Data Fig. 3). Nonclassical adipocytes were dispersed in the tissue, relatively rare among total PLIN1+ adipocytes and without clearly discernable localization within adipose lobules, consistent with the dataset analysis of Backdahl et al.11 (Supplementary Fig. 10).
Fig. 5: Validating nonclassical adipocytes in hSAT and hVAT by immunofluorescence using specific markers.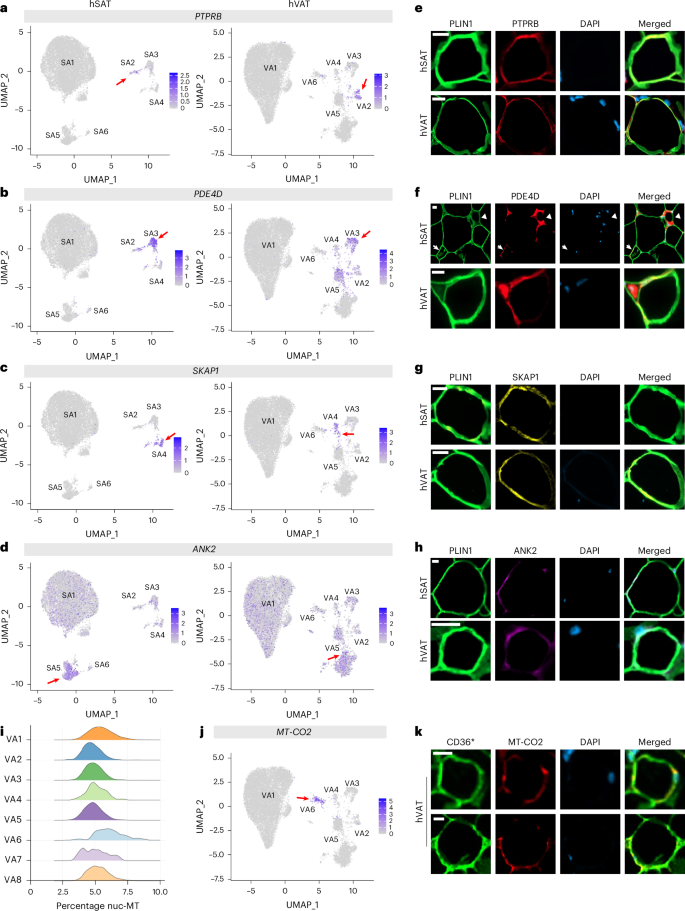
a–d, UMAP representations of hSAT (left) and hVAT (right) adipocyte subpopulations depicting the expression of specific markers used to identify each subpopulation of nonclassical adipocytes. The markers used were PTPRB (a), PDE4D (b), SKAP1 (c) and ANK2 (d), corresponding to the identification of SA2/VA2–SA5/VA5, respectively. The red arrow indicates the specific nonclassical adipocyte subpopulation represented by the marker. e–h, Representative images from both hSAT and hVAT of adipocytes displaying positive signal for the corresponding marker, visualized using immunofluorescence staining for PLIN1 (green), DAPI (blue), PTPRB (e; red), PDE4D (f; red), SKAP1 (g; yellow) and ANK2 (h; magenta). Scale bar, 20 μm. In f, the arrow indicates the PDE4D-positive adipocyte and the arrowhead points to a crown-like structure (CLS). Representative images of adipocytes from six to eight different patients (from at least two independent staining experiments) are shown. i–k, Validating VA6 in hVAT. i, Violin plots of nuc-MT gene expression in the hVAT adipocyte clusters VA1–8. VA6 had significantly higher expression of nuc-MT genes relative to other hVAT adipocytes (two-sided Mann–Whitney U-test P −16). j, Expression of MT-CO2 in hVAT adipocyte-clustering UMAP (arrow pointing to the relatively highly expressing VA6). k, Immunofluorescence staining for CD36 (green), MT-CO2 (red) and DAPI (blue). *Adipocytes identified with CD36 rather than PLIN1 to enable co-staining with MT-CO2. Scale bar, 20 μm. Representative images of adipocytes from five different patients (two independent staining experiments) are shown.
The hVAT-specific mito-ribosomal adipocyte subtype (VA6) was dubious owing to expression of mitochondrial genes. Yet, consistent with ref. 20, the hVAT adipocyte exhibited higher expression of nuclear-encoded mitochondrial (nuc-MT) genes compared with hSAT, with VA6 showing the highest expression (Fig. 5i and Supplementary Fig. 11). Immunostaining hVAT for the VA6 mitochondrial marker protein, MT-CO2 (Fig. 5j), revealed rare MT-CO2-positive adipocytes (positively stained for CD36 instead of perilipin, for technical reasons; Fig. 5k and Extended Data Figs. 2e and 3d). These analyses suggest that VA6 could represent a rare, bona fide hVAT nonclassical adipocyte subtype characterized by high mitochondrial content. Collectively, complementary approaches, different datasets and assessment of protein expression of RNA-based adipocyte subtype markers support the identification of classical and nonclassical adipocytes in the two human fat depots.
To determine whether classical and nonclassical adipocytes correlate with clinical characteristics, we used their sNucConv estimated proportions per sample in the 73 paired hSAT/hVAT bulk RNA-seq profiles of patients with severe obesity (Extended Data Fig. 4). Whereas classical adipocytes’ proportions in hSAT exhibited no correlation with body fat, their higher proportions correlated with lower waist:hip ratio and, consistently, with lower insulin resistance (assessed by the homeostatic model of insulin resistance). Conversely, higher hSAT nonclassical adipocyte proportions correlated with greater insulin resistance, an effect that trended similarly in hVAT although without reaching statistical significance. Higher hVAT classical adipocytes proportions tended to correlate with lower fasting triglyceride levels and predicted a smaller decline in triglycerides 1 year post-bariatric surgery. This is consistent with studies demonstrating greater metabolic benefits of bariatric surgery in patients with more severe, preoperative, obesity-related metabolic dysfunction. Predicting bariatric surgery outcome by preoperative hVAT classical adipocyte proportions highlights the potential for using estimated or directly assessed adipocyte subtype abundance in the clinic.
Differentiation trajectories toward adipocyte subtypes
Adipose tissues harbor a large and diverse population of mesenchymal stem cells with differentiation potentials to a range of terminal differentiation states. The subpopulation of cells most committed to become mature adipocytes are termed preadipocytes and the entire cell population is characterized by expressing PDGFRA, and termed adipose stem and progenitor cells (ASPCs9 or fibroadipogenic progenitors10). To investigate potential differentiation paths per depot from ASPCs toward classical and nonclassical adipocyte subtypes, we applied trajectory analysis tools21,22.
In hSAT, ASPCs were identified in a PDGFRA-positive cluster, comprising 26% of the nuclei (Fig. 6a), and could be divided into five subclusters, ASPC1–5, marked by known ASPC subtype markers (Fig. 6b-c). ASPC1 (32% of the ASPCs) expressed markers of highly proliferative multipotent progenitor cells9, including DPP-4 (ref. 23) and CD55 (ref. 10) and was F3 negative23 (referred to as adipose stem cells in ref. 8). ASPC2 (55%) expressed peroxisome proliferator-activated receptor-γ (PPARG) most highly and was CD9low, suggesting its commitment to adipocyte fate24. ASPC3 (9%) expressed markers of profibrotic progenitor cells (CD9high), previously observed and designated myofibrogenic progenitors in humans and mice23,24. ASPC4 expressed PDE4D most highly.
Fig. 6: Estimated differentiation paths from ASPCs to adipocytes in hSAT and hVAT.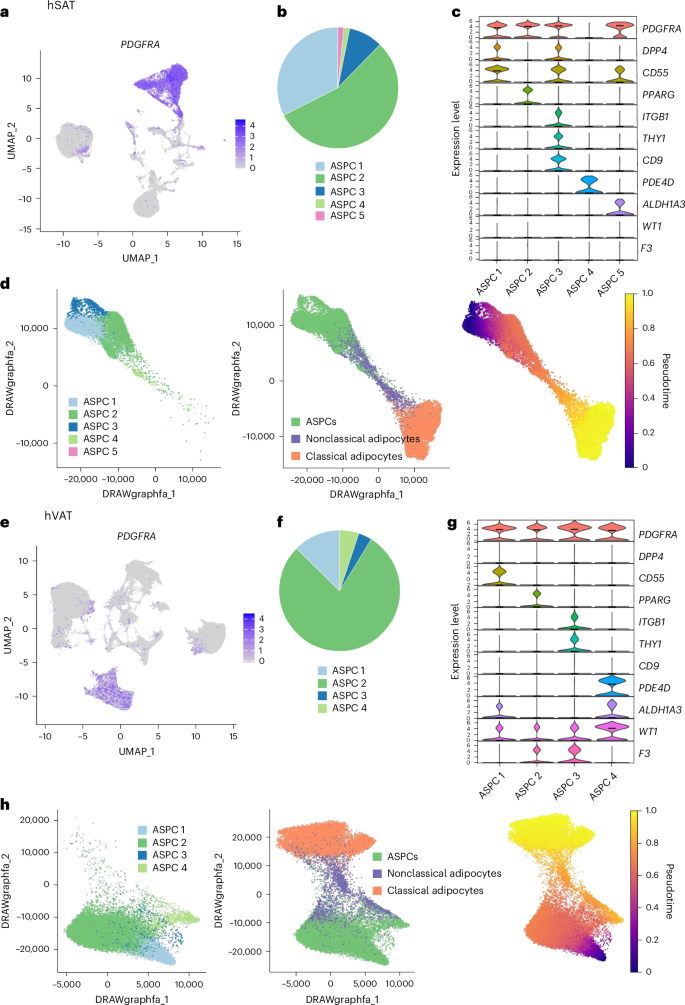
a, The expression of the ASPC marker PDGFRA in UMAP representations of hSAT snRNA-seq atlases. ASPCs constitute a well-defined cluster. b, The proportion of ASPC subclusters within the hSAT ASPCs. c, The expression of ASPC markers and of stem, fibrosis and adipogenic markers in hSAT ASPC subclusters. d, ASPCs, classical and nonclassical adipocytes in hSAT colored by cell group (left) with inset showing ASPCs colored by subcluster. Right, nuclei colored by their differentiation pseudotime from ASPCs (ASPC1). Nonclassical adipocytes were an intermediate state between ASPCs and classical adipocytes. Visualization was performed using ForceAtlas2 (FA) representation. e,f, Same as a (e) and b (f) for hVAT. g, The expression of ASPC markers and stem, fibrosis, adipogenic and mesothelial markers in hVAT ASPC subclusters. h, Same as d for hVAT. Nonclassical adipocytes appear as an intermediate state between ASPCs and classical adipocytes. ASPC4 shows a pseudotime comparable to nonclassical adipocytes, suggesting that it might lead to a different end-state.
As expected, a clear pseudotime path connected hSAT ASPCs to adipocytes (Fig. 6d): the proliferative ASPC1, which was the starting state for this analysis, and the profibrotic ASPC3, which was the most distant from adipocytes, whereas ASPC2 and ASPC4 were the closest. Importantly, classical adipocytes were the probable terminal differentiation state via nonclassical adipocytes. This suggests that the classical adipocyte differentiation state stems from loss, rather than gain, of nonclassical adipocytes’ functions.
In hVAT, PDGFRA-positive hVAT-ASPCs (Fig. 6e) were divided into four subclusters (ASPC1–4), sharing markers and integrated nicely with hSAT-ASPC1–4 (Fig. 6f,g and Supplementary Fig. 12b). Trajectory analysis showed that, as in hSAT, the proliferative (ASPC1) and the profibrotic (ASPC3) clusters were the most distant from adipocytes, whereas the committed (ASPC2) clusters were closer (Fig. 6h). Furthermore, as in hSAT, hVAT-ASPCs linked to classical adipocytes via nonclassical adipocyte subtypes (Fig. 6h).
In both depots, trajectory analysis using an alternative tool, alternative starting points and a stringently filtered dataset consistently showed that classical, rather than nonclassical, adipocytes, are an ASPC differentiation end-state (Supplementary Note and Supplementary Figs. 12–14). Furthermore, supporting the ASPC → nonclassical adipocytes → classical adipocytes differentiation path were the result of ImageStream flow cytometry analyses, recently shown to enable capturing both stromal cells and adipocytes25. PTPRC protein (CD45, common leukocyte antigen), the mRNA of which was preferentially expressed in SA3–4/VA3–4 immune-related, nonclassical adipocytes (not shown) was observed by both immunohistochemistry and immunofluorescence (Extended Data Fig. 5a–d). Moreover, immunostaining of CD45 followed by flow cytometry readily identified stromal vascular fraction cells, potentially macrophages and CD45− adipocytes (based on round morphology, diffuse Bodipy neutral lipid staining, CD36+, nuclear Draq5− (ref. 26) and with typically polarized light scattering; Extended Data Fig. 5e). Using the same criteria, ~7% of cells had membrane-appearing CD45 staining in adipocytes, which typically were of small size. The presence of particularly small-sized PTPRC/CD45+ adipocytes is consistent with the notion that nonclassical adipocytes are an intermediate between adipocyte precursor cells and full-sized, lipid-laden, terminally differentiated, CD45−, classical adipocytes.
Depot-specific adipocyte communication routes
Adipose tissues are key endocrine organs relying on adipocyte paracrine communication. We first examined the adipocyte-generated hormones adiponectin and leptin. Both were expressed similarly across hSAT and hVAT adipocyte subtypes (except that leptin was largely missing from VA7; Extended Data Fig. 6a). Next, we examined their receptors: adiponectin signals through ADIPOR1, ADIPOR2 and CDH13 (T-cadherin), whereas leptin uses LEPR. In both depots, ADIPOR1 was largely absent from all adipocyte subtypes, ADIPOR2 was ubiquitous, CDH13 was expressed uniquely by angiogenic adipocytes (SA2/VA2) and LEPR was expressed in most subtypes (Extended Data Fig. 6a). In nonadipocytes, ADIPOR2 expression was detectable only in a few hVAT cell types, although, like mast cells and endothelial cells, they were present in both depots (Extended Data Fig. 6b). It is interesting that CDH13 expression characterized endothelial cells in both depots (although lymphatic endothelial cells expressed CDH13 only in hSAT), suggesting that adiponectin may similarly affect angiogenic adipocytes and endothelial cells.
We explored additional, adipocyte subtype, communication routes. CellphoneDB27 analysis showed that communication among adipocytes was more active in hSAT than hVAT (212 versus 110 median interactions, respectively; Supplementary Data 5 and Fig. 7a). Next, we estimated communication probabilities among adipocyte subtypes for specific interadipocyte ligand–receptor pairs using CellChat28, which also suggests ‘key’ incoming and outgoing signaling pathways (Fig. 7b–i). Adiponectin signaling was a key pathway in both depots (Fig. 7b). Classical adipocytes (SA1/VA1) were the main senders of adiponectin in both depots, possibly reflecting their dominant proportions among the various adipocyte subtypes (Fig. 7b). Leptin signaling was a key pathway only in hVAT (Fig. 7c), consistent with low LEPR expression in SA1 (Extended Data Fig. 6a and Supplementary Data 5). This suggests that, although hSAT is the major source of leptin production29,30, its classical adipocytes might be less leptin sensitive.
Fig. 7: Adipocytes and immune cells in hSAT and hVAT intercellular and signaling communication patterns.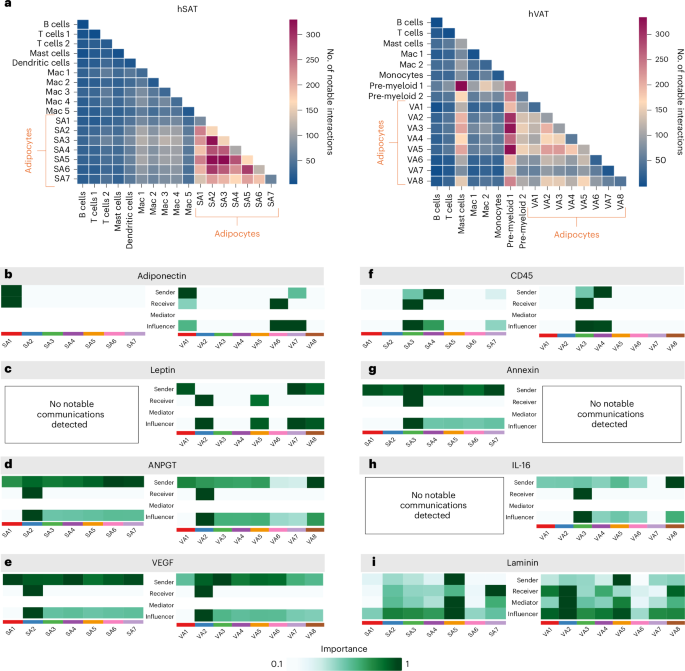
a, The total number of interactions between cell types in hSAT and hVAT. The number of interactions among adipocyte subtypes is higher in hSAT. The number of interactions between adipocytes and the macrophage or myeloid compartment or mast cells is higher in hVAT compared with hSAT. The heatmap was calculated using CellPhoneDB. b–i, The senders and receivers of specific signaling pathways among adipocytes in hSAT and hVAT. Analysis was performed using CellChat. b, classical adipocytes as the main senders of adiponectin in both depots. c, Leptin pathway missing from hSAT. In hVAT, classical adipocytes VA1 and VA7,VA8 are the main senders and VA2 and VA5 the main receivers. d,e, In both depots, angiogenic adipocytes SA2,VA2 are the main receivers of the angiogenesis-related ANGPT (d) and VEGF (e) signaling pathways. f, In both depots, immune-related adipocytes SA4,VA4 and SA3,VA3 are the main senders and receivers, respectively, of the immune CD45 signaling pathway. g, In hSAT alone, the anti-inflammatory signaling pathway Annexin is received mainly by SA3. h, In hVAT alone, the proinflammatory signaling pathway IL-16 received mainly by VA3. i, In both depots, the ECM adipocytes SA5,VA5 are the main senders of the ECM-related laminin signaling pathways.
Other signaling pathways revealed several subtype-specific patterns. In both depots, angiogenic adipocytes (SA2/VA2) were the most likely adipocyte subtype to be targeted by the angiogenesis-related angiopoietin (ANGPT) and vascular endothelial growth factor (VEGF) signaling pathways (Fig. 7d,e). Immune-related adipocyte subtypes (SA3–4/VA3–4) similarly exhibited the immune pathways CD45 (Fig. 7f) and colony stimulating factor (CSF; Supplementary Data 5) as key signaling pathways. However, although the hSAT SA3 adipocytes were targeted by the anti-inflammatory annexin (Fig. 7g) and galectin pathways (Supplementary Data 5), their respective hVAT VA3 equivalents were targeted by the proinflammatory interleukin (IL)-16 key pathway (Fig. 7h). This is consistent with the notion of hVAT being more inflammatory than hSAT, suggesting that these adipocyte subtypes participate in mediating this depot difference. ECM adipocytes (SA5/VA5) were the main senders of the laminin pathway, which plays major roles in adipose tissue ECM deposition31, in both depots (Fig. 7i).
We further explored whether the hSAT–hVAT difference in inflammatory communication extends beyond adipocytes by also considering the adipose macrophage or myeloid compartment (including bona fide macrophages, dendritic cells, monocytes and pre-myeloid cells). In hSAT, adipocyte subtype interactions with this cell compartment were clearly less pronounced relative to intra-adipocyte interactions (two-sided Mann–Whitney U-test P −9; Fig. 7a). In hVAT, in contrast, adipocyte interaction with subclasses of this compartment (pre-myeloid 1 and 2) seemed to be more intense (two-sided Mann–Whitney U-test P = 0.002; Fig. 7a). Similarly, in hVAT, mast cells interacted more with adipocytes and myeloid cells than in hSAT (Fig. 7a). To further explore this seemingly enhanced proinflammatory pattern in hVAT compared with hSAT, we examined the IL-16 and annexin pathways on including the macrophage or myeloid compartment. The proinflammatory IL-16 signaling involved many cell types of the macrophage or myeloid compartment in both depots and with similar intensity, except for the unique role of VA3 as the sole adipocyte subtype receiver (Supplementary Data 5I,K). The anti-inflammatory annexin signaling was much more pronounced in hSAT versus hVAT and involved many more cell types as senders or receivers (Supplementary Fig. 15 and Supplementary Data 5). We also observed low interaction intensity between adipocytes and mast cells in hSAT compared with hVAT (Fig. 7a). Mast cells were targeted by adiponectin in hVAT but not in hSAT (Extended Data Fig. 6b) and, as source, were highly involved in ECM, fibrosis and IL-16 pathways in hVAT (Extended Data Fig. 7). Thus, depot-differential communication patterns between adipocyte subtypes and mast cells may also contribute to the differential inflammatory and fibrotic ‘tone’ between the two fat depots.