Multiple scales of 3D genome organization in human cancers
We profiled genome-wide chromosome conformation in 69 tumor samples representing 15 primary human cancer types using H3K27ac HiChIP22,23 (Methods). These 15 cancer types were chosen based on overlap with samples previously profiled by the assay of transposase-accessible chromatin using sequencing (ATAC–seq)12 and to represent the diversity of human cancers (Fig. 1a and Supplementary Table 1). All HiChIP experiments demonstrated signal enrichment at gene promoters and sufficient numbers of uniquely mapped contacts for further analysis (Extended Data Fig. 1a–c). To enable integration with additional donor-matched data generated by TCGA, including ATAC–seq, RNA sequencing (RNA-seq) and WGS data, we validated donor identity based on single-nucleotide polymorphism (SNP) genotyping calls (Extended Data Fig. 1d)12. WGS of 268 TCGA samples analyzed for chromatin accessibility was also extended to 75× coverage for tumor samples and 25× coverage for matched normal samples to facilitate interpretation of CN variations (CNVs), point mutations and SVs (Extended Data Fig. 1e,f and Supplementary Table 2; Methods).
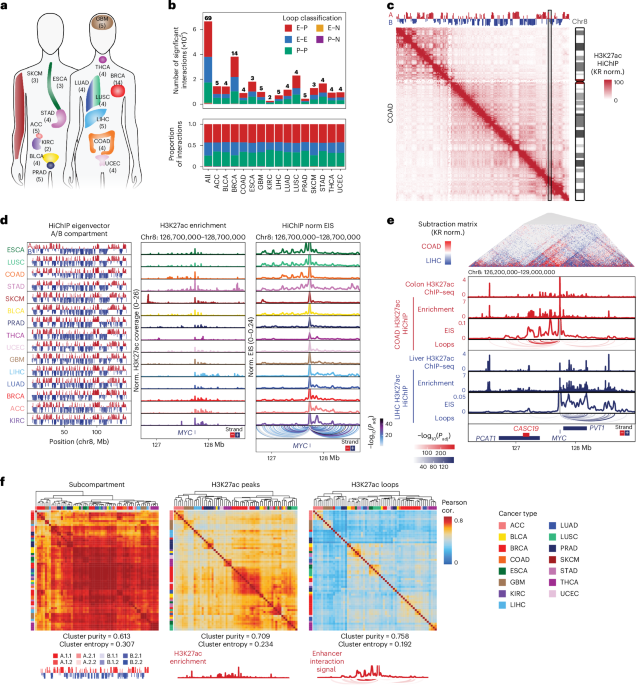
Fig. 1: HiChIP identifies high-resolution chromosome conformation in primary human cancers across multiple scales.
a, Schematic representation of the 15 cancer types profiled in this study. b, Stacked bar plot of the number of unique significant FitHiChIP interactions identified by H3K27ac HiChIP by cancer type and colored by loop classification (E–P, E–E, P–P, E–N and P–N). The numbers shown above each bar represent the number of samples profiled for each cancer type. c, KR matrix balancing-normalized H3K27ac HiChIP contact matrix at 250-kb resolution for merged COAD samples on chromosome 8. Top track displays the first principal component of Pearson’s matrix eigenvector of the KR-normalized observed/expected matrix, corresponding to A/B compartment. d, First eigenvector of the KR-normalized observed/expected matrix, corresponding to A/B compartment, for all samples merged by cancer type (left). One-dimensional H3K27ac signal enrichment at the MYC locus normalized by reads overlapping TSS for all samples merged by cancer type (middle). Interaction profiles of the MYC promoter representing EIS for all samples merged by cancer type (right). Significant loop interactions colored by adjusted P value are shown below. P values were calculated using a two-sided binomial test and corrected using the BH procedure. Cancer types are ordered based on H3K27ac signal bias at the MYC locus. e, Subtraction matrix comparing KR-normalized H3K27ac HiChIP at 10-kb resolution from merged COAD and LIHC samples at the MYC locus (top). Tracks visualize H3K27ac ChIP–seq enrichment from normal tissue profiled by ENCODE, HiChIP 1D H3K27ac enrichment, interaction profiles of the MYC promoter, and significant loop interactions colored by adjusted P value. P values were calculated using a two-sided binomial test and corrected using the BH procedure. f, Unsupervised hierarchical clustering of vectorized HiChIP subcompartment annotations (left), HiChIP 1D H3K27ac signal (middle), and HiChIP 2D interaction signal (right). Heatmap colored by Pearson correlation coefficients. Cluster purity quantifies the degree that samples of the same cancer type cluster together with higher values, indicating better clustering performance, while for cluster entropy, lower values indicate better clustering performance. Representative subcompartments, H3K27ac enrichment and EIS tracks illustrating the data type used for correlation analysis are shown at bottom.
We identified 665,682 unique significant interactions, or loops, associated with putative regulatory elements marked by H3K27ac, including complex E–P interactions such as enhancer-skipping of nearest genes (Fig. 1b and Extended Data Fig. 2a–f). Additionally, we compared our pan-cancer loop set with previously identified loops from H3K27ac HiChIP profiling of cell lines and primary tissue samples (Extended Data Fig. 2g)25. Overall, 71% of our loops overlapped with previously identified loops, and we also identified 188,887 looping interactions not observed in previous datasets. HiChIP interaction matrices revealed A/B compartment level organization at the megabase scale reflected in the first eigenvector of the correlation matrix, which was largely consistent across different cancer types and concordant with A/B compartments estimated from DNA methylation correlation matrices26 (Fig. 1c,d and Extended Data Fig. 2h).
To explore enhancer connectome diversity between different cancer types, we first considered the MYC oncogene located on chromosome 8, which is regulated by surrounding tissue-specific enhancers12,27. We assessed one-dimensional (1D) H3K27ac ChIP enrichment detected by HiChIP and observed H3K27ac enrichment either at regulatory elements located 5′ of MYC in cancer types such as colon adenocarcinoma (COAD) or at 3′ regulatory elements as in liver hepatocellular carcinoma (LIHC; Fig. 1d,e). This bias in H3K27ac reflected tissue-specific H3K27ac enrichment observed in healthy colon and liver, as well as previously observed trends in chromatin accessibility from matched samples12,28 (Fig. 1e and Extended Data Fig. 2i). Furthermore, we observed corresponding biases in 3D organization at the MYC locus using HiChIP, reflected in differential contact frequency in the interaction matrix and direction of significant loops linked to the MYC promoter (Fig. 1e and Extended Data Fig. 2j). Finally, 5′ or 3′ bias in enhancer activity was also reflected in enhancer interaction signal (EIS) at the MYC promoter, as determined by virtual 4C analysis, which reflects both H3K27ac ChIP signal strength and chromosome conformation contact strength with the designated anchor (Fig. 1d,e).
We further examined the scales of genome topology that distinguished human cancer types, leveraging the multiscale data yielded by HiChIP. We noted that H3K27ac enrichment as well as 2D interaction signals were impacted by CNVs, and for subsequent analyses, we applied CN correction based on WGS ploidy-corrected CNV calls, excluding seven samples without matched WGS from further analysis (Extended Data Fig. 2k; Methods). First, we performed Pearson correlation and hierarchical clustering using vectorized subcompartment annotations reflecting higher order chromosome conformation29 (Fig. 1f). Individual samples exhibited high pairwise correlation at the subcompartment level, and some cancer types were not well separated by hierarchical clustering, similar to prior observations of conserved compartment organization between different cell and tissue types1,8,30. Second, we found that 1D H3K27ac enrichment associated with cell-type-specific enhancers31,32 provided better cancer-type specificity, reflected in a higher cluster purity and lower cluster entropy following hierarchical clustering (Fig. 1f and Extended Data Fig. 2l; Methods). Finally, 2D HiChIP signal at significant interactions in the union loop set provided the best separation between different cancer types, and clustering was concordant with prior clustering based on bulk RNA-seq, ATAC–seq and DNA methylation12 (Fig. 1f and Extended Data Fig. 3a).
Dimensionality reduction of either H3K27ac peak or HiChIP loop signal, followed by t-distributed stochastic neighbor embedding, also separated samples by cancer type and was consistent with previously described ATAC–seq clusters (Extended Data Fig. 3b–d)12. Additionally, sample clustering reflected additional features, such as separation between basal and nonbasal breast cancers (Extended Data Fig. 3e) and differences between esophageal squamous cell carcinoma (ESCC) and esophageal adenocarcinoma (EAC; Extended Data Fig. 3f)33. To identify differential H3K27ac peaks and HiChIP loops, we used feature binarization12,34 to identify features that are unique to a specific cancer type or subset of cancer types and identified 28,716 differential H3K27ac peaks and 5,073 differential loops (Extended Data Fig. 4a,b). Consistent with prior results from chromatin accessibility profiling, cancer-type-specific peaks and loops identified by HiChIP were enriched for relevant transcription factor (TF) motifs, including p63 in squamous cancers (ESCC and lung squamous cell carcinoma (LUSC)) and androgen response elements in prostate adenocarcinomas (PRAD; Extended Data Fig. 4c,d). Interestingly, we noted that some TFs were preferentially enriched in H3K27ac-associated loops relative to H3K27ac peaks, suggesting that these TFs may potentially be more relevant for 3D looping interactions. Expanding on our observation of cancer-type-specific regulation of MYC, we identified 51 oncogenes with >5 linked differential H3K27ac peaks, nominating tissue-specific regulatory elements (Extended Data Fig. 4e and Supplementary Table 3).
Furthermore, we noted multiple loci that were enriched for H3K27ac in multiple cancer types but engaged in differential looping in specific cancer types, although most differential peaks overlapped with a differential loop (Extended Data Fig. 4f). For example, we identified a putative regulatory element located −9 kb of the ESR1 gene encoding estrogen receptor α that is marked by H3K27ac in nonbasal breast invasive carcinomas (BRCA), thyroid carcinoma (THCA) and uterine corpus endometrial carcinoma (UCEC), but with increased looping to the ESR1 promoter in UCEC, which correlates with higher ESR1 expression (Extended Data Fig. 4g). Additionally, we identified more complex examples, such as an H3K27ac peak overlapping histone H4 gene H4-16 with differential looping interactions to several nearby genes that correlates with the expression of the interacting gene (Extended Data Fig. 4h). These results suggest that 3D cancer genomes have globally similar compartment organization, but enhancer-associated histone modifications and fine-scale E–P loops distinguish different cancer types.
Oncogene expression by enhancer rewiring or CN gain
We next examined the roles of the 3D genome in oncogene transcription. We focused on 110 consensus driver oncogenes that were found to be recurrently mutated or overexpressed across different cancer types35. The 3D chromatin landscape across cancer types suggested the following three classifications of enhancer usage: (1) static enhancer usage, exemplified by NRAS (encoding neuroblastoma RAS viral oncogene homolog); (2) selective enhancer connectivity in one cancer type, such as EGFR (encoding epidermal growth factor receptor) in glioblastoma; and (3) highly dynamic patterns of enhancer contacts, including MYC (encoding MYC proto-oncogene, bHLH transcription factor; Fig. 1d, Extended Data Fig. 5a,b and Supplementary Table 4). Individual oncogenes varied considerably in the number of E–P loops identified by HiChIP, suggesting that enhancer activity may contribute to RNA expression in a gene-specific manner (Extended Data Fig. 5c).
In addition to enhancer rewiring, DNA CN has a profound effect on oncogene expression. Not only do amplified genes tend to be more highly expressed due to additional DNA copies, but they may also explore different gene regulatory space19,20,36. We first compared CN and enhancer activity for cases with low, intermediate or high RNA expression and found variable contributions depending on the gene. For example, MET showed a strong correlation between H3K27ac HiChIP signal and RNA expression with minimal changes in DNA CN (Fig. 2a). In contrast, differences in KRAS RNA expression reflected DNA CNVs while H3K27ac HiChIP signal was largely unchanged. To determine the relative contributions of both enhancer usage and CNVs on oncogene transcription, we performed an integrated analysis using H3K27ac HiChIP, bulk RNA-seq and WGS. We used multiple linear regression to determine the relative contributions of DNA CN and enhancer interaction score to variance in RNA expression across all driver oncogenes and cancer types (Fig. 2b). To account for multiple coordinated enhancers, for each gene, we identified all significant HiChIP looping interactions as well as overlapping H3K27ac peaks and took the top five principal components of H3K27ac signal across all samples (Extended Data Fig. 5d). We noted correlations between DNA CN and the first principal component of H3K27ac signal, which was mitigated by CN regression (Extended Data Fig. 5e).
Fig. 2: Differential contributions of CN and enhancer activity explain variability in oncogene expression.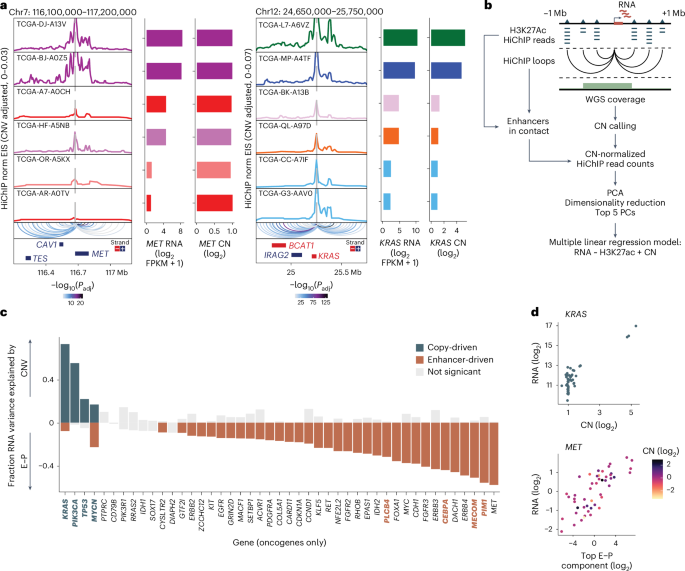
a, Interaction profiles of the MET and KRAS promoters for individual samples with high (rank 1 and 2 of 56 samples with matched RNA-seq, WGS and HiChIP data), intermediate (rank 28 and 29) or low (rank 55 and 56) RNA expression with significant loop interactions colored by adjusted P value. P values were calculated using a two-sided binomial test and corrected using the BH procedure. Bar plots visualize RNA expression and CN inferred from WGS. b, Schematic representation of analysis to infer contribution of enhancer interaction gain or gene CN to oncogene mRNA expression level. c, Oncogenes with variance in RNA expression >1 (n = 45) ranked by the fraction of RNA variance explained by CNV or linked enhancer activity across cancer samples. Each column is a gene. Genes with dark blue-colored bars on the top are significantly explained by CNV, while genes with orange-colored bars on the bottom are significantly explained by enhancer signal (E–P; H3K27ac term with the highest relative importance for each gene is shown). Genes in bold dark blue or orange text are also significant when cancer type is included in regression analysis. d, Scatter plot of the relationship between DNA CN and RNA expression for copy-driven gene KRAS (top) and E–P interaction signal and RNA expression for enhancer-driven gene MET (bottom). FPKM, fragments per kilobase of transcript per million mapped reads.
Overall, we found that both H3K27ac signal and DNA CN explained variance in RNA expression, although individual genes differed substantially in how much variance in RNA expression could be explained by either CN or enhancer activity (Fig. 2c and Extended Data Fig. 5f,g). Given the prevalence of cancer-type-specific enhancers, we also performed regression analysis with cancer type included and found that while cancer type explains a considerable proportion of variance and reduces the variance explained by E–P signal, the variance explained per gene for both CN and E–P signal is highly correlated in both analyses (Extended Data Fig. 5f,h,i). Quantitative analysis showed that for the majority of all genes and over 70% of oncogenes, mRNA expression is better explained by gains in enhancer activity, while expression of the remaining genes is better explained by DNA CN (Fig. 2c and Extended Data Fig. 6a). When comparing to patterns of static, selective or dynamic enhancer usage as defined above, we find that only oncogenes with selective and static enhancer usage were copy-driven, while all classes of enhancer usage can be enhancer-driven (Extended Data Fig. 6a). While some of the top copy-driven oncogenes have more extreme variation in CN, several enhancer-driven oncogenes have comparable variation in CN, suggesting that gene classification is not solely driven by extreme changes in CN (Extended Data Fig. 6b). The pattern of enhancer or copy-driven oncogene expression is remarkably binary and consistent (Fig. 2d and Extended Data Fig. 6c,d). This analysis demonstrates that CN amplification explains overexpression for a few oncogenes, while enhancer activity better accounts for most cases, highlighting the role of the 3D regulatory landscape in oncogene activation.
Cell-type-specific E–P loops in the tumor microenvironment (TME)
Epigenetic regulation of immune cells profoundly impacts cancer development; however, knowledge regarding enhancer–promoter interactions in the TME is limited. We developed a computational framework to deconvolute H3K27ac HiChIP into cell-type-specific signals using patient-matched single-cell ATAC–seq (scATAC–seq)37 (Fig. 3a and Supplementary Table 5; Methods). For instance, we identified a myeloid cell-specific enhancer–promoter interaction for the CD274 gene (encoding programmed death-ligand 1 (PD-L1)) in lung adenocarcinoma (LUAD) sample TCGA-86-A4P8 (Fig. 3b). HiChIP revealed an interaction between the CD274 promoter and a regulatory element marked by H3K27ac located +110 kb away, adjacent to previously described enhancers38. scATAC–seq analysis from the same sample validated myeloid-specific accessibility at this enhancer, with minimal accessibility in malignant or other immune cells. In contrast, an enhancer −140 kb away from the promoter of the CCND3 gene (cyclin D3) displayed chromatin accessibility specific to malignant cells (Extended Data Fig. 7a).
Fig. 3: Deconvolution of HiChIP signal resolves malignant and immune cell-specific chromatin conformation in TME.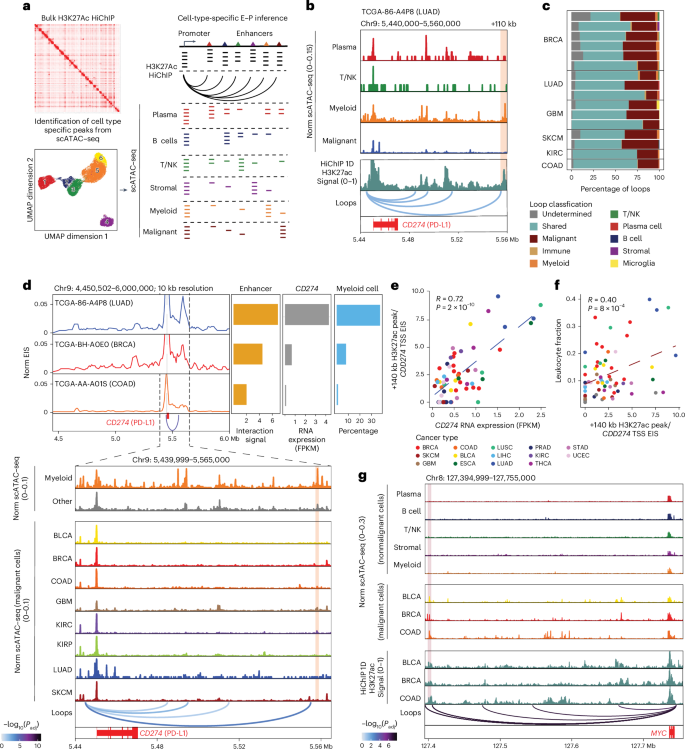
a, Schematic representation showing identification of cell-type-specific enhancer–promoter interactions using integration of HiChIP and scATAC–seq data. b, Signal tracks showing scATAC–seq and H3K27ac HiChIP at CD274 locus (encoding PD-L1) for sample TCGA-86-A4P8. The scATAC–seq track indicates the chromatin accessibility of different cells in TME (top). The H3K27ac HiChIP track indicates the bulk H3K27ac signal (middle). The interaction track indicates the CD274 promoter-associated interactions. The shaded area indicates the myeloid cell-specific H3K27ac peak. c, Bar plot of loop annotation based on scATAC–seq/HiChIP integration for samples with matched scATAC and H3K27ac HiChIP. d, Integrative virtual 4C and scATAC–seq signal tracks showing the myeloid cell-specific enhancer–promoter interaction for CD274 (encoding PD-L1). The virtual 4C plot shows the EIS changes (left) with matched CD274 RNA expression and myeloid cell percentages based on scATAC–seq (right). The scATAC–seq track indicates the chromatin accessibility of myeloid cells, noncancer cells and cancer cells across eight different cancer types (bottom). The marked area indicated the myeloid cell-specific H3K27ac peak. Significant loop interactions are colored by adjusted P value, and P values were calculated using a two-sided binomial test and corrected using the BH procedure. e, Scatter plot showing the correlation between the enhancer–promoter interaction and CD274 RNA expression. The correlation coefficient was calculated using Pearson correlation, and the P value was calculated using a two-sided t test. f, Scatter plot showing the correlation between the enhancer–promoter interaction and RNA-seq-derived leukocyte fraction estimation. The correlation coefficient was calculated using Pearson correlation, and the P value was calculated using a two-sided t test. g, Signal tracks showing the integrative track of scATAC–seq and H3K27ac HiChIP at MYC locus. The scATAC–seq track indicates the chromatin accessibility of different noncancer and cancer cells in eight cancer types (top). The H3K27ac HiChIP track indicates the bulk level H3K27ac signal in BLCA, BRCA and COAD (middle). The interaction track indicates the MYC promoter-associated interactions. The shaded area indicates H3K27ac peaks that overlap with cancer risk-associated SNPs. Significant loop interactions are colored by adjusted P value, and P values were calculated using a two-sided binomial test and corrected using the BH procedure.
We extended this framework to 29 patients with matched H3K27ac HiChIP and scATAC–seq, focusing on 16 samples with sufficient nonmalignant cells for scATAC–seq peak calling (Methods). Most E–P interactions overlapped with scATAC–seq peaks that were accessible across multiple cell types; however, we were able to identify cell-type-specific interactions (Fig. 3c). In total, we identified 1,551 malignant cell-specific and 745 immune cell-specific interactions. Immune cell-associated E–P interactions displayed significantly lower correlation with tumor purity and higher correlation with RNA-seq-derived leukocyte fraction estimates compared to malignant cell-associated E–P interactions (Extended Data Fig. 7b,c; Methods)39,40. Gene Ontology analysis revealed that malignant cell enhancer contacts were enriched for cell division and growth genes, while those in tumor-associated myeloid, B and T/natural killer (NK) cells were linked to immune pathways (Extended Data Fig. 7d).
PD-L1, encoded by CD274, is a ‘don’t kill me’ signal that dampens anticancer T cell responses and is a major target for cancer immunotherapy41. While commonly expressed by malignant cells, PD-L1 is also highly expressed by immune cells in the TME, including macrophages and dendritic cells42. We identified a dynamic enhancer located 110 kb 3′ of CD274 with E–P interaction signal correlated with CD274 mRNA expression, leukocyte fraction estimation and myeloid cell frequency estimated by scATAC–seq (Fig. 3d–f, Extended Data Fig. 7e and Supplementary Table 6; Methods). Pseudobulk single-cell chromatin accessibility analysis further supported the myeloid specificity of this enhancer, which was uniquely accessible in myeloid cells (Fig. 3d). We also examined T/NK cell-specific E–P interactions for IKZF1, a known regulator of immune cell development expressed by multiple immune cell types, including T cells43. While the IKZF1 promoter is accessible across multiple immune cell types in the TME, we identified an intronic, T/NK cell-specific enhancer with significant looping to the promoter (Extended Data Fig. 7f). The IKZF1 E–P interaction signal correlated positively with IKZF1 RNA expression as well as leukocyte fraction estimation but negatively with tumor purity estimation (Extended Data Fig. 7g,h). In addition, many E–P interactions exhibited shared chromatin accessibility between malignant and immune cells, including immune checkpoint genes like CTLA4, TIGIT, VSIR and TIM3 (refs. 44,45; Supplementary Table 6 and Extended Data Fig. 7i). These results suggest that the immunological setpoints of cancers reflect the contributions of multiple cell types in the TME.
scATAC–seq-based deconvolution enabled the classification of malignant cell-specific E–P interactions, nominating enhancers linked to altered gene expression in transformed cells (Fig. 3c). Gene Ontology analysis revealed that one of the most significantly enriched sets of enhancer target genes is the MYC pathway (Extended Data Fig. 7d). We enumerated malignant cell-specific E–P loops at the MYC locus in BLCA, BRCA and COAD samples (Fig. 3g). MYC EIS positively correlated with MYC mRNA expression and tumor purity estimation but negatively correlated with leukocyte fraction estimation (Extended Data Fig. 7j,k). Genome-wide association studies have identified numerous noncoding variants associated with increased risk of cancer. Seven SNPs associated with cancer risk map to the cancer-specific MYC enhancers (Extended Data Fig. 7l), including the COAD risk variant rs6983267 that has been replicated in multiple cohorts46,47,48,49,50, suggesting that these variants exert their effect by impacting MYC expression in transformed cells rather than immune or stromal cells. We extend this SNP analysis to all malignant cell-specific E–P interactions, providing a comprehensive list of risk SNPs linked to target genes (Supplementary Table 7).
Three-dimensional genome reveals targets of noncoding regulatory mutations
Identification of somatic mutations in active regulatory elements with higher allele frequencies in H3K27ac HiChIP compared to WGS can nominate noncoding mutations that may promote enhancer activity to drive cancer initiation and progression (Fig. 4a). Building on prior efforts using WGS as well as ATAC–seq to nominate functional noncoding variants12,51, additional WGS and HiChIP data generated in this study provide additional power to nominate functional variants and to identify target genes. Using somatic mutations identified by WGS, we calculated mutant allele frequencies in H3K27ac HiChIP, achieving a median correlation of 0.54 with ATAC–seq data (Extended Data Fig. 8a). We then quantified the mutant allele’s impact on enhancer activity based on the average H3K27ac signal changes within a 2-kb region centered on the single-nucleotide variant relative to all cases with only the reference allele (Fig. 4a; Methods). We identified 7,517 somatic mutations (2,975 promoter mutations and 4,542 enhancer mutations) with higher variant allele frequency in H3K27ac HiChIP over WGS (Fig. 4a and Extended Data Fig. 8b; Methods), suggesting enhanced regulatory activity.
Fig. 4: Integration of WGS and HiChIP identifies cancer-relevant regulatory mutations and target genes.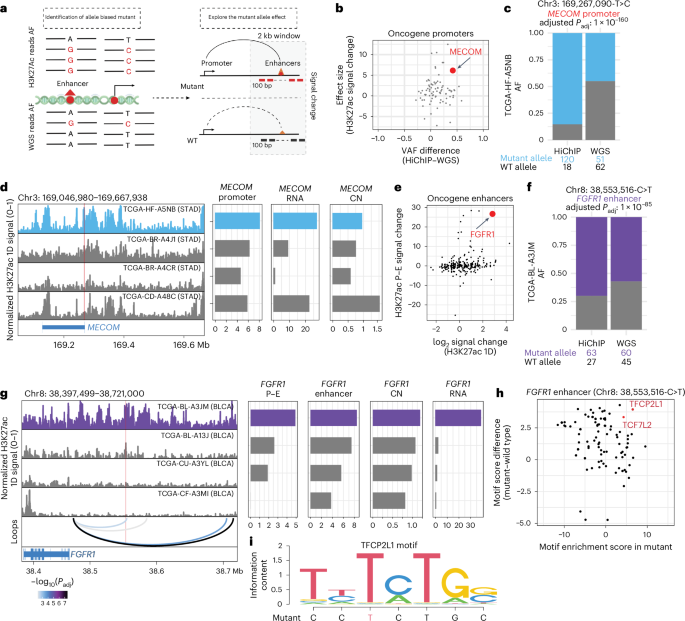
a, Schematic representation showing the workflow of identifying the H3K27ac-associated noncoding mutations. b, Scatter plot indicating the relationship between oncogene promoter-associated HiChIP and WGS allele frequency differences and the effect size (T score) of the associated H3K27ac signal change between mutant and wild-type patients. The T score was calculated by a two-sided t test. c, Bar plot showing the allele frequency of chr3: 169,267,090-T>C (MECOM) mutant between HiChIP and WGS for sample TCGA-HF-A5NB (STAD). The P value was calculated by Fisher’s exact test and corrected using the BH procedure. d, Signal tracks showing the integrative track of H3K27ac HiChIP at MECOM locus normalized by reads in TSS. The H3K27ac 1D signal track indicates the bulk level H3K27ac signal in STAD samples (left). Mutant patient TCGA-HF-A5NB is highlighted in blue. The chr3: 169,267,090-T>C mutant position is labeled in red line. Bar plots indicate matched H3K27ac signal (CN corrected), MECOM expression and CN at MECOM locus. e, Scatter plot quantifying the relationship between enhancer activity and enhancer–promoter interaction changes for oncogene-associated enhancers with somatic variants. f, Bar plot showing the allele frequency of chr8: 38,553,516-C>T (FGFR1 enhancer) mutant between HiChIP and WGS for sample TCGA-BL-A3JM (BLCA). The P value was calculated by Fisher’s exact test and corrected using the BH procedure. g, Signal tracks showing the integrative track of HiChIP 1D H3K27ac enrichment at FGFR1 locus normalized by reads in TSS. The H3K27ac 1D signal track indicates the bulk level H3K27ac signal (CN corrected) and FGFR1 enhancer–promoter interactions in BLCA samples (left). Mutant patient TCGA-BL-A3JM is highlighted in purple. The chr8: 38,553,516-C>T mutant position was labeled in red line. Bar plots indicate matched H3K27ac signal, FGFR1 expression and CN at FGFR1 locus. Significant loop interactions are colored by adjusted P value, and P values were calculated using a two-sided binomial test and corrected using the BH procedure. h, Scatter plot indicating the association between chr8: 38,553,516-C>T mutant-involved motif enrichment changes and motif enrichment scores in chr8: 38,553,516-C>T mutant region. i, Motif sequence plot showing the overlap between the mutant sequence and the enriched motif sequence for TFCP2L1. AF, allele frequency.
Among oncogene promoter variants, this analysis nominated a stomach cancer-associated variant (chr3: 169,267,090-T>C) in the MECOM promoter, showing a higher allele frequency in HiChIP (85%) than WGS (45%; Fig. 4b,c) and increased H3K27ac signal (Extended Data Fig. 8c). Furthermore, a concordant trend between H3K27ac signal changes and mRNA expression levels was observed across different patients, except for sample TCGA-CD-A48C, which had high RNA expression despite modest H3K27ac signal at the MECOM promoter. Examination of WGS data revealed a focal amplification of the MECOM locus for this sample, suggesting that either noncoding promoter mutation or gene copy amplification can promote oncogene overexpression (Fig. 4d). Indeed, MECOM RNA expression and H3K27ac promoter signal for the sample with the chr3: 169,267,090-T>C variant rank in the top 16% of TCGA STAD RNA-seq and top 5% of pan-cancer H3K27ac HiChIP (Extended Data Fig. 8d,e). As noncoding mutations can create new binding sites for TFs that may promote gene overexpression, we compared motif enrichment scores between MECOM chr3: 169,267,090-T>C mutant and wild-type sequences (Extended Data Fig. 8f). Differential motif analysis nominated AHR and FOXM1 as the most significant TF motif gained by the T>C change in the MECOM promoter (Extended Data Fig. 8g), and RNA-seq data analysis confirmed the expression of AHR and FOXM1 in the tumor sample (Extended Data Fig. 8h).
We next investigated the presence of enhancer mutations that may impact gene expression and regulatory element activity. We first validated the previously identified FDG4 enhancer mutation in the BLCA cohort using HiChIP (Extended Data Fig. 8i)12. Consistent with ATAC–seq data, the sample with the chr12: 32,385,775-C>T variant showed substantially higher H3K27ac signal compared to noncarriers (Extended Data Fig. 8i). To further nominate functional noncoding variants, we examined both 1D H3K27ac enrichment and E–P looping assessed by HiChIP and nominated 2,214 variants with increased E–P interaction signal (Extended Data Fig. 8j). The chr8: 38,553,516-C>T variant linked to the FGFR1 promoter in BLCA exhibited allelic bias in HiChIP data and an eightfold increase in H3K27ac signal (Fig. 4e–g and Extended Data Fig. 8k). This variant dramatically enhanced E–P interaction signal (1.4- to 70-fold) and FGFR1 expression, ranking in the top 1% of the BLCA cohort, without evidence of CNVs (Fig. 4g and Extended Data Fig. 8l). Differential motif analysis revealed that the C to T change created a new binding motif for the TFCP2L1 TF (Fig. 4h,i), which is associated with cell cycle progression and stemness during bladder cancer progression52 and is highly expressed in the affected sample (Extended Data Fig. 8m). Finally, high FGFR1 expression correlated with worse prognosis in BLCA, suggesting functional consequences of this enhancer-associated noncoding mutation (Extended Data Fig. 8n).
Extensive enhancer rewiring from structural rearrangements
An additional source of somatic alterations with substantial impact on 3D genome organization are structural rearrangements19,53. Integration of WGS analysis with H3K27ac HiChIP provides unique insight into the regulatory impact of both simple and complex structural rearrangement events, in particular focal amplifications that can promote oncogene overexpression (Fig. 5a). We first examined the regulatory impact of simple SVs identified by WGS, including deletions, duplications, inversion and translocations (Extended Data Fig. 9a). Rearranging the connectivity of DNA segments can result in both increased contact probability between two previously distant DNA segments and the formation of new TADs and new E–P loops across SV junctions. We used NeoLoopFinder to reconstruct the HiChIP interaction matrices for SVs identified by WGS, such as a translocation linking enhancers on chromosome 20 with the PIK3R1 oncogene on chromosome 5, and identified new TADs (neoTADs) and new E–P contacts (neoloops), validating the SV reconstruction and nominating new regulatory interactions54 (Methods; Extended Data Fig. 9b). Among all classes of simple SVs, we find that translocations tend to have higher proportion of SVs with at least one neoloop and substantially more neoloops/Mb detected per SV as well as more total loops (Extended Data Fig. 9c–e), suggesting that translocations may promote more extensive enhancer rewiring compared to other simple SV classes.
Fig. 5: Impact of structural rearrangement and ecDNA amplification on enhancer connectivity.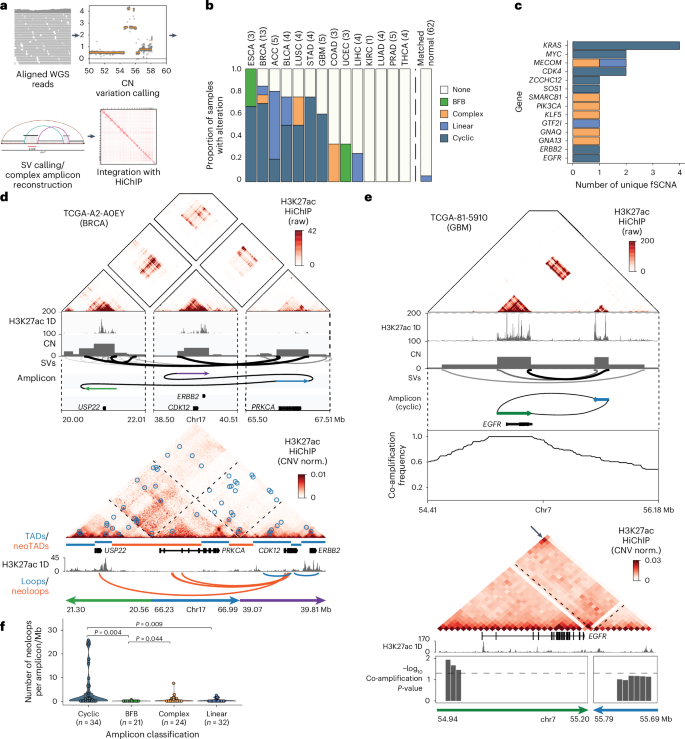
a, Workflow of the joint HiChIP–WGS analysis for simple structural variants and complex focal amplifications. b, Distribution of cyclic, BFB, complex and linear somatic focal amplifications detected across 62 tumor whole-genome samples with corresponding HiChIP data and 62 patient-matched normal samples as controls. c, Distribution of cyclic, BFB, complex, linear fSCNA affecting oncogenes. d, Raw HiChIP contact matrix of ERBB2 rearrangement with tracks visualizing H3K27ac 1D signal enrichment, CN inferred from WGS, SVs identified by WGS and amplicon prediction (top). The raw, unnormalized HiChIP contact matrix allows for visualization of regions of high HiChIP signal before normalization, which correspond to amplifications and structural rearrangements detected by WGS. CN-normalized HiChIP contact matrix with tracks visualizing TADs/neoTADs, H3K27ac 1D signal enrichment and loops/neoloops (bottom). e, Raw HiChIP contact matrix of a cyclic (ecDNA-like) EGFR rearrangement with tracks visualizing H3K27ac 1D signal enrichment, CN inferred from WGS, SVs identified by WGS, amplicon prediction and co-amplification frequency across all TCGA WGS samples (top). Tracks visualizing H3K27ac 1D signal enrichment and significance of co-amplification with CN-normalized HiChIP matrix below (bottom). Arrow indicates increased interaction signal indicative of a circular amplicon. f, Violin and box plot quantifying neoloops per megabase within cyclic, BFB, complex, linear amplifications identified by NeoLoopFinder (n = number of unique amplifications). Loop counts are quantified for each focal amplification, normalized by the size of the focal amplification and classified as a neoloop if they span an SV breakpoint. P values were calculated using a two-sided Wilcoxon rank-sum test and adjusted using the BH procedure. Box centerline, median; box limits, upper and lower quartiles; box whiskers, 1.5× interquartile range. fSCNA, focal somatic CN amplifications.
Complex rearrangements link specific amplification classes to distinct DNA repair mechanisms and regulatory features, including breakage-fusion-bridge (BFB) or translocation-bridge55 cycles of chromosomal instability and ecDNA formation. Notably, ecDNA amplification, associated with poor clinical outcomes, drives gene overexpression through increased DNA accessibility, enhancer co-amplification and nuclear colocalization56,57,58,59. Focal genomic amplifications were detected from WGS data using AmpliconArchitect and classified based on the predicted connectivity of discordant breakpoints as linear, complex, cyclic (with head-to-tail connectivity characteristic of ecDNA) or BFB (Fig. 5a,b)59,60,61. Cyclic amplifications associated with ecDNA were one of the most frequent SVs among solid tumors affecting multiple oncogenes, and many tumors exhibit multiple distinct molecular species of ecDNAs (Fig. 5c and Extended Data Fig. 9f).
HiChIP data confirmed the spatial proximity of the three distal genomic segments encompassing the ERBB2 and CDK12 genes involved in a complex rearrangement and nominated several new E–P interactions linked to the CDK12 gene (Fig. 5d). Predicted cyclic amplicons, such as those involving EGFR and MDM2, were further validated by increased HiChIP interaction frequency at the corner of the matrix (Fig. 5e and Extended Data Fig. 9g). Finally, regulatory elements marked by H3K27ac involved in cyclic amplicons were substantially co-amplified across the TCGA cohort based on WGS data (Fig. 5e and Extended Data Fig. 9g). In addition, we find that ecDNAs exhibit extensive sequence heterogeneity even within individual tumors. In cases where multiple amplicons were nominated by WGS, including multiple cyclic cycles involving EGFR, HiChIP provided orthogonal support for the dominating rearrangement, which was supported by a high interaction frequency (Fig. 5e and Extended Data Fig. 9h).
Overall, we find that different classes of rearrangements impact gene regulation at distinct scales, with ecDNA generating the largest number of new E–P loops, as well as larger overall numbers of E–P loops, compared to BFB or linear amplicons (Fig. 5f and Extended Data Fig. 9i). These findings underscore diverse mechanisms of structural rearrangements driving epigenetic rewiring in cancer.