The MM-like genomic score captures disease progression
To characterize the somatic mutation landscape and drivers in precursor conditions of MM, we generated and analyzed deep WGS data on bone marrow samples from patients with MGUS (n = 19), SMM (n = 119) and MM (n = 20) and their patient-matched germline controls (median coverage: 50× in tumor samples, 35× in normal samples; Supplementary Table 1). Given that bone marrow samples contain a small fraction of MGUS/SMM cells (median, 15%), we first enriched these cells and used a low-input DNA protocol19 to reliably extract and sequence tumor DNA (median purity, 81%; Methods). This enabled us to evenly characterize the 119 SMM patients from the three currently used risk groups (International Myeloma Working Group 2/20/20 criteria: 44 low-risk, 29 intermediate-risk and 46 high-risk patients with SMM).
To increase cohort size and power for driver discovery, we combined our precursor-enriched dataset with genomic data from 872 additional individuals with MGUS (n = 18), SMM (n = 62) and MM (n = 792), comprising 810 genomes and 853 exome profiles, yielding a map of somatic mutations of MM and its precursors from 1,030 individuals (Supplementary Table 1). For each tumor, we identified somatic point mutations (single-nucleotide variants (SNVs) and small insertions and deletions (indels)), copy-number alterations and structural variants (SVs; non-coding mutations and SVs were available for 969 samples with WGS data). Our analysis is powered to discover candidate drivers mutated in 2% of patients20 (Extended Data Fig. 1a). Indeed, analysis of random samples of the cohort confirmed that the number of drivers found in ≥2% of patients increases and plateaus at around 1,000 patients (Extended Data Fig. 1b,c).
First, we set out to discover candidate drivers of MM and precursor conditions. We identified 62 genes with significantly recurrent point mutations (MutSig2CV, q KRAS, NRAS, FAM46C, DIS3, BRAF and TP53; (2) eight new candidate drivers (IKZF3, IKBKB, HNRNPU, FIP1L1, SGPP1, SP3, EHD1 and HNRNPA2B1); and (3) 15 additional candidates mutated in 1a and Supplementary Table 2). Notably, IKZF3 (mutated in 1% of patients) is required for the generation of high-affinity long-lived plasma cells21 and is also a known driver of chronic lymphocytic leukemia (CLL)22 and diffuse large B cell lymphoma23. In individuals for whom no MM SNV driver event was found, at least one canonical initiating MM event was evident. These included either one of the known translocations, hyperdiploidy (trisomy of two or more of the odd-numbered chromosomes (3, 5, 7, 9, 11, 15, 19 or 21)), gain of 1q or deletion of 13q (Extended Data Fig. 1d). Next, we analyzed copy-number alterations and found 54 significant recurrently altered regions (21 chromosome arms, 18 gains and 3 losses; 33 focal events, 4 gains and 29 losses; GISTIC2.0 q MYC, BCMA, FAM46C, CDKN2C, CYLD and FGFR3/MMSET as well as other significantly altered regions, including TERC/GPR160, EVI5, BCL6, BIRC2/3 and XBP1 (Fig. 1a and Supplementary Table 3). Finally, we discovered 11 additional candidate driver structural variations, including two known canonical drivers (NSD2 and MAF; Fig. 1a; see below). When comparing the number of driver events across MM stages, we observed that precursor patients already harbor at least one MM-driver alteration (Fig. 1a). However, the number of drivers increased with MM progression. For example, point mutation drivers were rare in MGUS (median, 0; range, 0–2), increased in SMM (median, 1; range, 0–7) and further increased in MM (median, 2; range, 0–10) (Extended Data Fig. 1e).
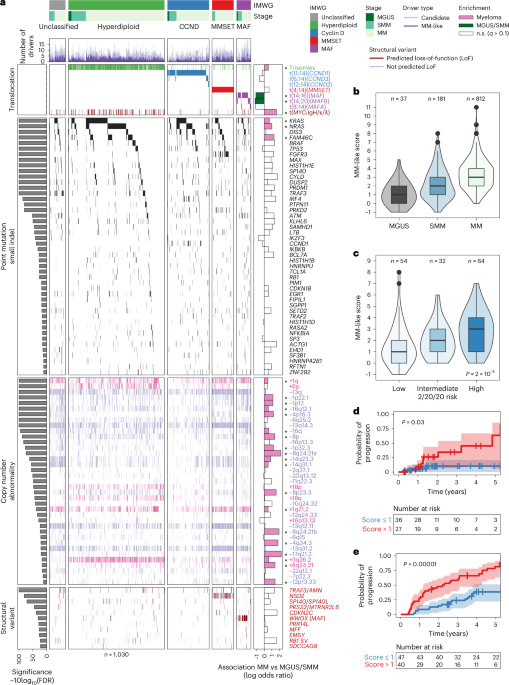
Fig. 1: The MM-like score, derived from the somatic landscape of MM, places precancer stages on a gradual axis of progression toward overt disease.
a, Waterfall plot illustrating the genomic architecture of MM and its precursors MGUS and SMM across mutation classes (SNVs, small indels, copy-number alterations, SVs and translocations) from a comprehensive collection and harmonization of tumor data (n = 1,030 patients). Samples are grouped by genetic subtypes from the International Myeloma Working Group (IMWG) classification: MAF (translocations of the MAF family of oncogenes), MMSET (translocations of the NSD2 gene), CCND (translocations of the cyclin D family of genes), hyperdiploid (trisomies of odd-numbered chromosomes) and unclassified (other genetic subtypes). Common drivers significantly enriched in MGUS/SMM are colored in green, and those significantly enriched in MM are colored in pink in the rightmost panel. The ‘MM-like’ score of a tumor is then defined as the sum of MM-like drivers minus the sum of MGUS/SMM drivers. FDR, false discovery rate; IgH/κ/λ, immunoglobulin heavy/kappa/lambda chain; n.s., not significant. b, Boxplot depicting a gradual increase in the MM-like score from MGUS (n = 37; median, 1) and SMM (n = 181; median, 2) to MM (n = 812; median, 3). c, In patients with SMM for whom IMWG classification 2/20/20 was evaluable, boxplot showing an increasing MM-like score from low-risk to high-risk categories (low, n = 54; median, 1; intermediate, n = 32; median, 2; high, n = 64; median, 3). Kruskal–Wallis test, d.f. = 2, P = 1.99 × 10⁻⁵. Two-sided Dunn’s test for post-hoc comparisons: low versus intermediate risk: statistic = −1.48, q = 0.139; intermediate versus high: statistic = −2.41, q = 0.03; high versus low: statistic = −4.61, q = 1.24 × 10⁻⁵. d,e, Kaplan–Meier curve illustrating the probability of progression of untreated SMM to MM based on the MM-like score in WGS from this study (d) (n = 63, log-rank test statistic = 5.59, d.f. = 1, P = 0.02, Wald test for MM-like score strictly above median of 1, hazard ratio (HR), 5.3; 95% CI, 1.1–25; P = 0.03) and validated in an orthogonal dataset8 (e) (n = 87, log-rank test statistic 21.07, d.f. = 1, P = 4 × 10⁻⁶, Wald test for M-like score > 1, HR, 3.3; 95% CI, 1.8–6.2, P = 5 × 10⁻⁵). In boxplots, the center line represents the median, the box limits represent the upper and lower quartiles and the whiskers indicate 1.5 times the interquartile range. Values exceeding whiskers appear individually as plain circles.
Next, we defined a score reflecting the gradual progression from MGUS/SMM to MM by testing whether initiating translocations and each of the 103 driver alterations occurring in >1% of patients were found at different frequencies between MGUS/SMM and MM (Supplementary Table 4). Using the WGS cases, we found 26 such events (q MAF and MAFB translocations (MAF: odds ratio (OR), 3.1; confidence interval (CI), 1.6–5.8; q = 0.0026; MAFB: OR, 3.4; CI, 1.1–9.8; q = 0.04). The other 24 alterations were more common in MM and included known drivers of the disease (MYC: OR, 5.0; CI, 2.2–14; q = 5 × 10⁻⁵; NRAS: OR, 2.7; CI, 1.5–5.3; q = 0.009; KRAS: OR, 1.9; CI, 1.2–3.3; q = 0.09; Fig. 1a and Supplementary Table 4). We then defined a genomic score by subtracting the number of MGUS/SMM-enriched drivers from the number of MM-enriched drivers for each tumor and named it the ‘MM-like’ score. As expected, the MM-like score increased throughout disease progression (median MM-like score of 1 in MGUS, 2 in SMM and 3 in MM; Fig. 1b). Among patients with SMM only, who can be stratified into three groups with the 2/20/20 model4, we found a gradual increase of the MM-like score that matched the overall medians in MGUS, SMM and MM (median scores of 1 in low-risk, 2 in intermediate-risk and 3 in high-risk SMM groups, respectively; P = 2 × 10⁻⁵; Fig. 1c). An MM-like score above the median (score > 1) correlated with a higher chance of progression to MM in patients who were untreated for SMM with WGS data available (hazard ratio (HR), 5.3; 95% CI, 1.1–25; P = 0.03; Fig. 1d). We first validated this association between an increased MM-like score and higher rates of progression to MM using an internal dataset of 87 patients with SMM patients from a previous publication8. (HR, 3.3; 95% CI, 1.8–6.2; P = 5 × 10⁻⁵; Fig. 1e). We then confirmed this association using an external validation dataset of 77 patients with SMM from another publication9 with deep targeted sequencing data, despite the fact that this dataset included only mutations and translocations (HR,1.8, 95% CI, 1.1–3.0; P = 0.03; Extended Data Fig. 2a). When analyzed in multivariate regression, we found that the MM-like score was independently associated with a higher chance of progression in a model stratified by cohort (HR, 2.8, 95% CI, 1.8–4.4; P = 7.6 × 10⁻⁶; Extended Data Fig. 2b). The MM-like score independently correlated with progression in the two validation cohorts8,9. In the WGS cohort, the overall multivariate model was just above significance (P = 0.06), and the MM-like score had the highest HR estimate compared to the 2/20/20 risk classification variables (Extended Data Fig. 2c–e). Overall, we show that it is possible to define a simple genomic score that can be used to assess the risk of progression to MM and can be implemented in the clinic by discovering drivers of the disease and detecting those associated with the stage of the disease.
The MM-like score increases in serially sampled patients with SMM
We next assessed whether the MM-like score of serial samples from patients with SMM reflects their clinical course. To that end, we collected 47 serial tumor samples (bone marrow or circulating tumor cells) from 20 patients, taken at various time points (from diagnosis to progression) up to 54 months (Supplementary Table 5). Of these patients, 16 were originally from the PCROWD study and four were collected as an external validation cohort (patients GP1–GP4). We calculated the MM-like score for each sample and observed that the score indeed captured the dynamic spectrum of the disease (Fig. 2a). For 11 out of 13 patients who did not progress, the MM-like score was stable over time. These included three patients with a follow-up time less than the first time to progression (10 months), suggesting that these patients probably did not have sufficient time to acquire an additional driver event and expand that subclone to a detectable level. Seven patients clinically progressed to MM, out of whom five also had an MM-like score that increased at the time of progression. One patient (GP3) who progressed to MM with a stable MM-like score had an elevated baseline score (4), and the last one (GP1) remains unexplained with genomic data alone. For the two remaining patients (SCI054 and SCI116), the MM-like score increased but they did not clinically progress (during the measured intervals). Still, one showed a doubling of free light chain ratio indicative of an underlying disease progression together with a bi-allelic TP53 inactivation, which rarely happens early in the disease development24. The increases in the MM-like score were a result of different driver events, including acquiring KRAS (G13D), NRAS (G13D), deletion of 1p and gain of 1q in the progressors and hyperdiploidy and deletion of 1p in two non-progressors, respectively (Fig. 2b,c and Supplementary Note 5).
Fig. 2: The MM-like score increases with progression to cancer and can be linked with clonal outgrowth.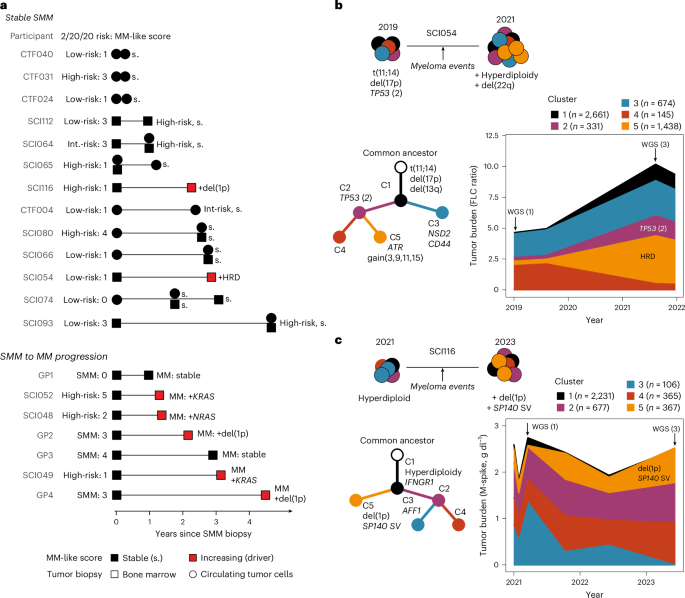
a, Swimmer plot showing the clinical efficacy of applying the MM-like score in a longitudinal sample setting, up to 54 months from initial biopsy. Patients characterized by either stable disease trajectory (n = 13, black symbols) or evolving genome (n = 7, red symbols) were identified, with increasing MM-like score driven by the acquisition of MM-driver mutations (KRAS, NRAS, deletion of 1p (del(1p)), hyperdiploidy (HRD)). b,c, Two examples of clinical relevance demonstrating the longitudinal impact of clinical WGS in detecting a MM-like score increase, with association with a subclonal outgrowth obtained from phylogenetic reconstruction of the disease history, and was correlated with an increase in tumor burden. The number of mutations found in each cluster is written to the right of the cluster name. MGUS monitoring over 3 years (b), with phylogenetic tree reconstruction to estimate clone driving growth and novel detection of hyperdiploidy within a bi-allelic TP53 mutant context. High-risk SMM monitoring over 2 years (c): phylogenetic analyses revealed newly acquired recurrent MM event of deletion of 1p and SP140 was identified and assigned to an emerging clone (cluster five (C5)). Concurrently, clinical M-spike levels show stable overall tumor burden. Clonal fractions from before the first WGS are kept equal to the first WGS timepoint for visual representation.
Taken together, these data show the ability of WGS data and the MM-like score to successfully capture the acquisition of MM drivers and, using clonal dynamics, identify the subclones that probably acquired and expanded the drivers.
Molecular tumor age of MGUS/SMM
To further delineate the time of initiation and cell-of-origin for MM precursor disease25,26,27, we estimated an upper bound for the time of the onset of the disease based on passenger mutations that accumulate in a clock-like manner (Methods). In particular, we focused on the 91 deep WGS tumors (14 MGUS, 46 SMM and 31 MM) with a clonal hyperdiploidy event assumed to be the initiating event24,28. There was a wide range of estimated initiation ages, from 1 to 92 years old (median, 35 years old). Interestingly, we found that the patient’s age at tumor initiation (that is, hyperdiploidy) correlated with the stage of the disease; the more advanced stages were initiated at a younger age (MGUS, 41 years old; SMM, 38 years old; MM, 31 years old; P = 0.0035, Fig. 3a). We could also estimate the age of each tumor by subtracting the tumor-initiating age from the patient’s age at the time of biopsy and confirmed that MGUS and SMM are younger tumors than MM (MGUS, 16 years old; SMM, 21 years old; MM, 33 years old; P = 0.004; Fig. 3b and Extended Data Fig. 3a,b).
Fig. 3: Precancer stages of MM have younger tumors at diagnosis, which evolve with late acquisition of MM-like features.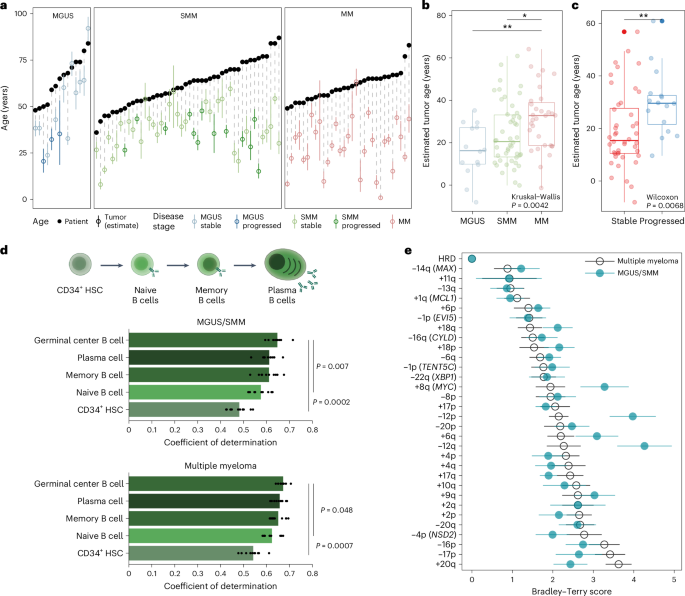
a, Maximum likelihood expectation and 95% CIs obtained from binomial mixture models for patients’ age at the initiation of the disease (black circles, patient age at sampling; colored circles, estimated age at the disease initiation) including MGUS (n = 14; median, 41 years old), SMM (n = 46; median, 38 years old) and MM (n = 31; median, 31 years old). b, Boxplot with point estimates and CIs for the molecular tumor age in MGUS (median, 16 years old), SMM (median, 21 years old) and MM (median, 33 years old). c, Boxplot showing that the tumor age estimated from early mutations was higher in patients with MGUS/SMM who progressed during the study versus those who remained stable (progressors: median, 30 years old; non-progressors: median, 15 years old). d, Using mutations across the genome, cell-of-origin analysis29 shows that the mutation profile of MM and MGUS/SMM origins correlates with germinal center, memory B cells and plasma cells. HSC, hematopoietic stem cell. Statistical significance was determined between each top hit and the subsequent models using a two-tailed corrected t-test on the values from the tenfold cross-validation, taking into account the interdependence of tests in a cross-validation setting. Panel created in part using BioRender.com. e, Bradley–Terry scores estimate (bootstrap mean and standard deviation of the log abilities) from the clonality league competition in MGUS/SMM (n = 218; green) and MM (n = 812; black). Green dots on the right represent events more likely to be subclonal in MGUS/SMM than in MM and, therefore, are acquired late in the evolution of the disease (that is, a higher Bradley–Terry score). Events +8q (MYC), −12p and −12q are significantly more clonal in the MM Bradley–Terry model than in the MGUS/SMM one, with an absolute difference in Bradley–Terry score of >1 (Supplementary Note 6). In boxplots, the center line represents the median, the box limits represent the upper and lower quartiles and the whiskers indicate 1.5 times the interquartile range. Values exceeding whiskers appear individually as plain circles.
Next, in patients with MGUS or SMM, we wanted to test whether the tumor’s age is associated with progression to MM. Indeed, we found that progressors had significantly older tumors than patients with stable disease (median, 15-year-old tumor in stable disease versus 30-year-old in progressors; P = 0.007; Fig. 3c). Notably, the tumor’s age was independently associated with progression to MM when compared with 2/20/20 risk classification (OR, 1.95; 95% CI, 1.08–4.01; P = 0.04; Extended Data Fig. 3c). Together, these data show that WGS-based molecular clocks can be leveraged to differentiate disease severity and risk of progression and that the earliest oncogenic events of MM can occur in the first decades of life.
Common cell-of-origin of MGUS/SMM molecular groups
The local distribution of mutations is shaped by the epigenetic organization, which varies along the genome as well as across cell types. To elucidate the B cell differentiation stage at which MGUS/SMM acquired most of its mutations, we used the cell-of-origin prediction method, which leverages correlations between somatic mutation profiles and epigenetic tracks from healthy tissues29,30. We found that among healthy mature B cell types (germinal center, plasma and memory B cells), germinal center B cells were significantly more correlated with somatic mutations than early immature B cell types (naive B cells, P = 0.007; hematopoietic stem cells, P = 0.0002; corrected t-test). This suggests that most passenger mutations are acquired during the later stages of B cell differentiation (Fig. 3d). Notably, the cell-of-origin predictions were comparable across MM subgroups (all coefficients of determination >0.5) and stages (all coefficients of determination >0.6) and remained consistent when we used early mutations only; that is, ones obtained before genomic amplifications (Extended Data Fig. 4a). Of note, we could not find a significantly different correlation between germinal center B cells and plasma cells in MM and its precursors, unlike in non-Hodgkin lymphoma and CLL from the International Cancer Genome Consortium (Extended Data Fig. 4b,c). Overall, this suggests that most mutations in these three neoplasias with a rearranged B cell receptor are acquired during mature B cell differentiation stages and confirms that only MM also acquires mutations in the plasma cell stage.
The order of acquisition of events across disease stages
Next, we wondered whether the order of acquisition of genetic abnormalities has a role in the progression to MM. To answer that question, we developed a Bradley–Terry model based on the clonality levels of MM copy-number drivers that we termed ‘clonality league comparison’ (Methods). In this model, each MM-driver event is given a Bradley–Terry score that reflects the probability that such an event is found in smaller subclones than others. This allowed us to rank MM-driver events: those that are most often clonal have the lowest Bradley–Terry score, and events that are thought to happen late in cancer development have higher Bradley–Terry scores. Then, to test whether the order of acquisition of events differs between the MGUS/SMM and MM stages, we compared the distributions of Bradley–Terry scores between both models (that is, between the MGUS/SMM and MM Bradley–Terry models). We identified three events with higher Bradley–Terry scores in the MGUS/SMM league model than in the MM one; that is, events that are late in MGUS/SMM and earlier in MM (q 1): gain of 8q24 (MYC), deletion of 12p and deletion of 12q (Fig. 3e, Extended Data Fig. 5a–c, Supplementary Table 7 and Supplementary Note 6). Of those, MYC and deletion of 12p were also captured by our MM-like score. Deletion of 12q correlated with deletion of 12p in single chromosome deletions, but the event did not reach significance alone in the MM-like score (q > 0.1). No event was significantly later in MM relative to MGUS/SMM. Overall, our Bradley–Terry model further supports the role of MYC abnormalities and potentially other MM drivers to provide a proliferation advantage toward overt disease.
Mutational processes and signatures in the MM spectrum
In addition to the sequential acquisition of genetic abnormalities, mutational processes could influence the transformation to MM. To discover and quantify mutational processes, we first used hierarchical Dirichlet processes31 to identify mutational signatures in the WGS data. Then, we associated them with known signatures from the Catalogue of Somatic Mutations in Cancer (COSMIC) (Fig. 4a and Methods)32. We found 21 signatures in our dataset, of which 13 also matched COSMIC signatures and accounted for >80% of the total mutation burden: somatic hypermutation and activation-induced cytidine deaminase (SHM/AID): SBS9, SBS84, SBS85; APOBEC: SBS2, SBS13; clock-like: SBS1, SBS5/40; reactive oxygen species signature SBS18 and signatures of unknown etiology SBS8, SBS16, SBS17a and SBS17b (Fig. 4a, Supplementary Table 8 and Supplementary Note 7). Of those, we could validate that APOBEC signatures were enriched in the MAF subgroup33, and we report a positive association between SBS8 and the cyclin D (CCND) group independent of the disease stage (Extended Data Fig. 6).
Fig. 4: The somatic landscape of MM and its precursors is shaped by physiological and cancer-like processes, which evolve after the initiation of the disease.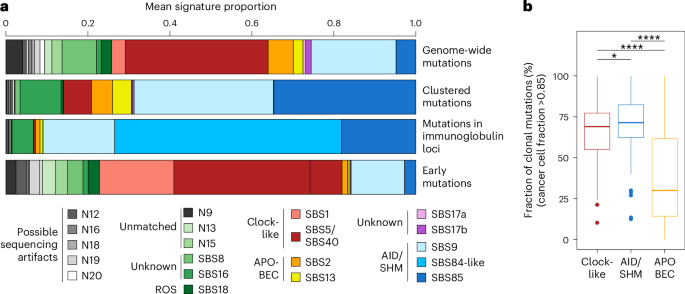
a, Proportion of mutational signatures for whole genomes (top row), restricted to clustered mutations only (within 1,000 bases of another; second row), which are typical of AID activity during SHM in the germinal center, and more specifically within immunoglobulin loci (third row; annotation from COSMIC reference v.3.3). The bottom row represents the proportion of mutational signatures for whole genomes using only early mutations in patients with hyperdiploidy; that is, mutations found at clonal levels on amplified chromosomes. SBS, single-base substitution; ROS, reactive oxygen species. b, Fraction of clonal mutations (median cancer cell fraction > 0.85) that are predicted to be caused by known mutational processes (clock-like signatures SBS5/40 and SBS1, AID/SHM signatures SBS9, SBS84 and SBS85, and APOBEC signatures SBS2 and SBS13) in all patients across the MM disease spectrum. Only deep WGS were used; samples from the CoMMpass study were excluded. Total of clonal mutations: clock-like, n = 14,996 out of 24,780, median, 69% per participant; AID/SHM, n = 11,415 out of 15,636, median, 71% per participant; APOBEC, n = 49,566 out of 101,922, median, 30% per participant. The center line represents the median, the box limits represent the upper and lower quartiles and the whiskers indicate 1.5 times the interquartile range. Values exceeding whiskers appear individually as plain circles. *P P P values are from Dunn’s test for pairwise, two-sided comparisons and were adjusted with the Holm–Bonferroni procedure: clock-like versus AID: P = 1.15 × 10⁻²; clock-like versus APOBEC: P = 2.6 × 10⁻⁷; AID versus APOBEC: P = 7.75 × 10⁻¹³.
Next, and in line with data from CLL34, we found that three signatures associated with SHM/AID activity (SBS9, SBS84 and SBS85) were highly enriched in clustered mutations (4a, second row), and the association was even stronger when we looked only at the immunoglobulin loci (Fig. 4a, third row). Mutations associated with SHM/AID and clock-like signatures were mostly clonal35 (median cancer cell fraction > 0.85: 71% and 69%, respectively; Fig. 4b). On the contrary, mutations that we associated with APOBEC activity were primarily found in subclones (median cancer cell fraction > 0.85: 30%). Furthermore, we could not find strong evidence of APOBEC activity in early mutations. Instead, early mutations were strongly enriched with clock-like signatures SBS1 and SBS5/40 in addition to SBS9 (AID), which is coherent with the phenotypically normal expansion of a B cell population before the emergence of an MGUS/SMM clone (Fig. 4a, last row). This suggests that cancer-like mutational processes (APOBEC and reactive oxygen species) increase after acquiring the initiating event of MGUS/SMM, which then gradually develops into MM.
Candidate drivers in hotspots of structural variation
We next searched for cancer driver genes that are affected by SVs. To do so, we developed a statistical method that analyzes SVs in the neighborhood of each gene and estimates whether SVs are causing loss-of-function events more often than expected by chance (Methods). Overall, we analyzed the 969 patients with WGS data and identified 11 candidate SV drivers (Fig. 1a, Extended Data Fig. 7a and Supplementary Table 9). Of the 969 patients, 300 (31%), spanning all stages of MM, had at least one candidate SV driver event. In addition to the known immunoglobulin heavy-chain (IgH)-initiating translocations that are associated with MM subgroups (NSD2/MMSET in t(4;14), WWOX, a fragile site proximal to MAF in t(14;16)), our method detected nine candidates. This list includes four known drivers that are commonly affected by copy-number alterations (CDKN2C, SP140, RB1 and TRAF3) as well as five new ones (EMSY, MFF, PRR14L, PRSS2 and SDCCAG8; Extended Data Fig. 7b). Except for the two IGH translocations, SV driver mutations were less common in MGUS/SMM genomes (8%; CI, 4–13%) than in MM (27%; CI, 24–30%; P = 4 × 10⁻⁶).
The close neighborhood of all SVs was enriched with mutations attributed to the AID and APOBEC signatures (5a, middle row), and the association was even stronger among SV drivers alone (88%; Fig. 5a, bottom row). We could differentiate between two categories of SVs: those involving immunoglobulin loci (IGLL5, MMSET, CCND, MAF) were highly enriched in AID, suggesting that they probably arose from translocations generated from double-strand break repairs in the germinal center that happened during late B cell differentiation (Fig. 5b). On the contrary, we found that all of the other seven SV drivers with mutations found in their neighborhood were enriched with APOBEC signature mutations (SBS2 and SBS13), which are not found in normal physiological B cell development and are often generated when single-stranded DNA overhangs are present during SV formation (Fig. 5b)36.
Fig. 5: The neighborhood of initiating and secondary translocations of MM and its precursors is marked by AID and APOBEC activities.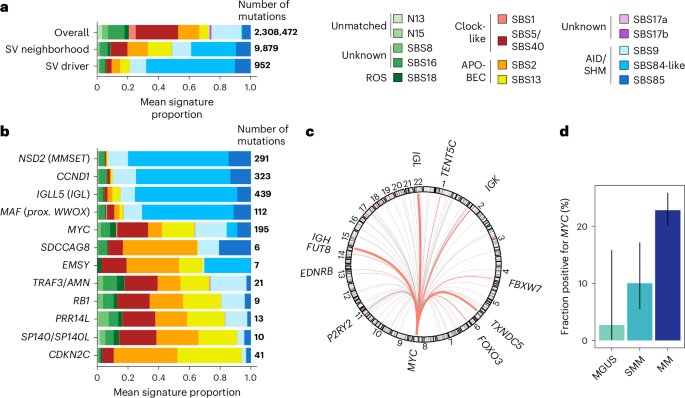
a, Relative frequency of mutational signatures in whole genomes (top row), close to SV breakpoints (b, For each SV driver and known canonical myeloma translocations (MMSET, CCND1, WWOX/MAF, MYC), frequency of mutational signatures close to SV breakpoints (CCND1, IGLL5 and MYC were added to the list of SV drivers because of their known importance in MM. c, Circos plot depicting partners of MYC (chromosome 8) in MGUS/SMM, with recurrent partners (≥3 patients) shown in pink. d, Fraction of patients with deep WGS performed and a MYC translocation detected (immunoglobulin or non-immunoglobulin) across disease stages. Error bars represent binomial proportion 95% CIs for the following counts: MGUS: n = 1 out of 37; SMM: n = 8 out of 120; MM: n = 151 out of 812; bar height represents the frequency itself.
As our algorithm to discover MM SV drivers focused on probable loss-of-function events, it did not capture the MYC translocation events. MYC translocations are known to influence MM disease progression and have been reported at various frequencies across precursor stages (from 0% to 24% (refs. 9,37,38)). In our study, we observed translocations of MYC in 9 out of 157 MGUS/SMM patients with WGS data, for an estimated frequency of 5.7% (CI, 2.8–11%). Similar to MM, both immunoglobulin (IgH, Igλ, Igκ) (n = 3) and non-immunoglobulin partner (n = 6) genes for MYC translocations were found. The most common non-immunoglobulin partner was BMP6/TXNDC5 (Fig. 5c). However, in the MGUS population, MYC was notably rare (none in the PCROWD study and one progressor case from another study38; Fig. 5d), confirming the known increased risk of transformation associated with MYC events (Fisher’s exact test, P = 9.3 × 10⁻⁵). Overall, this shows that structural variation data from WGS can be used to discover cancer drivers and associate them with clonal evolution and disease progression.
Non-coding candidate drivers and B cell biology
Next, we leveraged the DIG algorithm39 to discover non-coding MM candidate drivers. We found 66 non-coding elements to be significantly recurrently mutated across MGUS/SMM and MM (q 6a). Of those, 18 were in long non-coding and micro RNA and their promoters, 15 were in the 3′ and 5′ untranslated regions (UTRs) of coding genes, 13 were in promoter regions of coding genes, one was in an enhancer region proximal to TXNDC5, 12 were found in immunoglobulin regions and seven were considered mapping or sequencing artifacts after manual review (Supplementary Table 10).
Fig. 6: Non-coding mutation hotspots across MM stages reflect the history of the disease and candidate driver genes.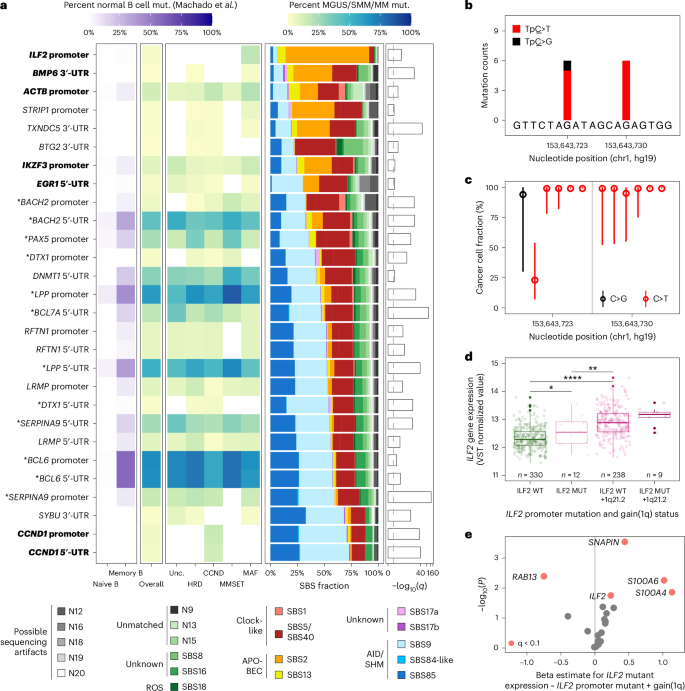
a, Filtered heatmap representing significantly hypermutated non-coding genes and regulatory elements detected with the DIG algorithm on MGUS, SMM and MM participants with deep WGS (overall, n = 177) and molecular subgroup in yellow-green-blue shades (CCND, n = 50; HRD, n = 68; MAF, n = 33; MMSET, n = 13; unclassified, n = 13). Left panel, fraction of normal B cell expansions with mutations in the same elements (naive B cells, n = 85 samples; memory B cells, n = 74 samples; data from Machado et al.30). Middle-right panel, mutational signature weights in each element. Right panel, q-score for each element hypermutation in MGUS, SMM and MM. Bold represents non-coding elements associated with known drivers of myeloma; asterisks indicate non-coding elements that are hypermutated in normal B cells. b, For the ILF2 promoter element, genomic coordinates, counts and tumor alleles found using deep WGS in this study (n = 12 mutations from nine participants: MGUS, n = 2; SMM, n = 6; MM, n = 1). c, Cancer cell fraction point estimates (maximum likelihood) and 95% CIs from ABSOLUTE59 for each mutant allele with deep WGS of this study (n = 12, median, 99%; range, 23–99%). d, ILF2 gene expression levels are grouped by status of the ILF2 promoter mutation and of gain of 1q from the CoMMpass study (n = 589 covered at the ILF2 promoter hotspots). Gene expression levels are given after variance-stabilizing transformation (DESeq2 (ref. 60); arbitrary gene expression units). ILF2 promoter wild-type (ILF2 WT): n = 330, median, 12.3; ILF2 promoter mutant (ILF2 MUT): n = 12, median, 12.5; ILF2 WT and gain of 1q: n = 238, median, 12.9; ILF2 MUT and gain of 1q: n = 9, median, 13.2. The center line represents the median, the box limits represent the upper and lower quartiles and the whiskers indicate 1.5 times the interquartile range. Values exceeding whiskers appear individually as plain circles. e, Volcano plot showing the increased expression levels of genes within the topologically associated domain surrounding ILF2 in patients from the CoMMpass study with an ILF2 promoter mutation versus wild-type (P value from the lm function in R; genes represented in red are statistically significant with q q is the P value adjusted for false discovery rate).
A total of 28 candidate elements could be directly associated with a coding gene target (3′-UTR, 5′-UTR, promoter), of which 17 were found mutated across MM subgroups and also in mature B cells30 (BACH2 promoter and 5′-UTR, BCL6 promoter and 5′-UTR, BCL7A 5′-UTR and so on; Fig. 6a, left). The AID signatures SBS9 and SBS85 were enriched in these 17 elements, consistent with off-target AID activity that could occur during normal B cell differentiation; we postulate that these mutations are less likely to drive cancer progression. Out of the 11 remaining non-coding elements, six were located in known MM drivers or key genes (promoter and 5′-UTR of CCND1, promoters of ILF2, 5′-UTR of EGR1, 3′-UTRs of BMP6 and TXNDC5); and five remain to be investigated (promoter and 5′-UTR of DTX1, promoter of STRIP1, 3′-UTRs of BTG2 and SYBU).
Next, we associated the candidate drivers with mutational signatures and MM subtypes. For instance, the CCND1 promoter and 5′-UTR were hypermutated only in the CCND subtype and are marked by SHM/AID activity (Fig. 6a, bottom rows). This suggests that the translocation occurred before the SHM and class-switch recombination in some cases. Conversely, the ILF2 promoter on chromosome 1q21.2 was mutated exclusively in tumors from the MAF subgroup (n = 9 out of 33 of MAF (27%) among the 177 cases with deep WGS; Fisher’s exact test P = 1.0 × 10⁻⁷) and was enriched with the APOBEC signature (Fig. 6b) in a CTCF binding peak region (Extended Data Fig. 8). The majority of ILF2 promoter mutations were clonal (11 out of 12 mutations found in nine patients; Fig. 6c) and spanned all disease stages (two MGUS, six SMM and one MM). Finally, we found that tumors with ILF2 promoter mutations have a higher expression of ILF2 and of three other genes in the same topologically associated domain (SNAPIN, S100A4 and S100A6) compared to wild-type cases, independent of 1q gains, and using 589 samples from the CoMMpass study with ILF2 promoter coverage40 (ILF2, P = 0.018; Fig. 6d,e, Extended Data Fig. 9a,b and Supplementary Table 12). Altogether, we provide a list of non-coding candidate drivers for MM and a dictionary of B cell-specific off-target mutations reflecting the B cell to plasma cell differentiation.