Isogenic model for TP53 mutagenesis by CRISPR-HDR
To assess the functional impact of TP53 variants in a controlled isogenic environment, we used HCT116 colorectal carcinoma cells, which are TP53 WT with a prototypical p53 response34,35,36,37. Refining established SGE techniques15,25,26, we inactivated one of the two TP53 alleles to ensure unambiguous genotype–phenotype correlations (Fig. 1a, Extended Data Fig. 1a–c and Supplementary Note 1). To avoid confounding effects from p53’s DNA-damage response during CRISPR–Cas9 gene editing38,39,40, we reversibly silenced expression from the remaining TP53 copy using a LoxP-flanked transcriptional stop cassette (LoxP-Stop-LoxP, LSL) containing selection markers. For mutagenesis via HDR, the resulting HCT116 LSL/Δ cell line was transfected with a CRISPR–Cas9 nuclease and a donor vector providing the desired mutation for templated repair.
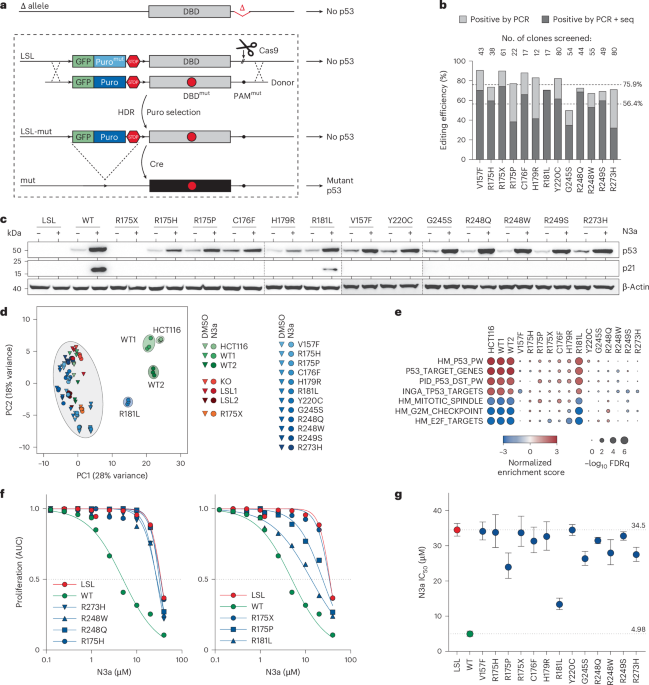
Fig. 1: Panel of single TP53 mutations in HCT116 cell lines.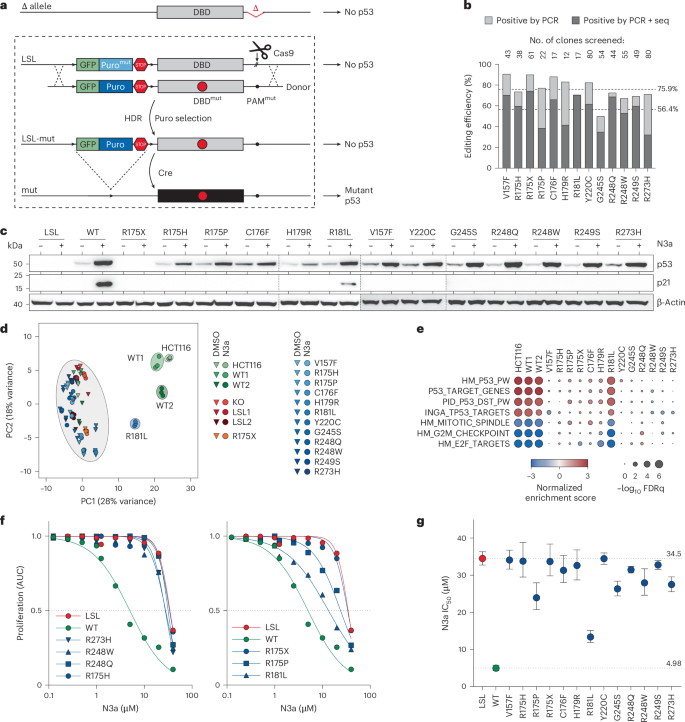
a, Scheme for CRISPR–Cas9-mediated TP53 mutagenesis via homology-directed repair (HDR) in HCT116 LSL/Δ cell line. b, Editing efficiency as percentage of single-cell clones that contain a targeted integration of the donor and the desired mutation analyzed by PCR and sequencing, respectively. Shown are results for single mutations and the mean across the panel. c, Western blot demonstrating mutant p53 and p21 protein expression in HCT116 clones after Cre-mediated excision of the LSL cassette in absence and presence of 10 µM N3a. d, Principal component analysis based on RNA-seq data of indicated cell clones ±N3a. e, Gene set enrichment analysis for p53-related gene expression signatures comparing indicated N3a- and DMSO-treated cell clones. f,g, Proliferation of TP53-mutant cell clones in presence of increasing concentrations of N3a analyzed by real-time live-cell imaging. f, Area under the proliferation curve relative to untreated. g, 50% inhibitory concentration (IC50, with 95% CI) for N3a with p53-null (LSL, red) and WT (green) as reference. 95% CI, 95% confidence interval; AUC, area under the curve; FDRq, false discovery rate q-value; LSL, LoxP-Stop-LoxP; Puro, puromycin.
We validated the editing performance by introducing a panel of TP53 variants, including some common cancer mutations with known LOF or pLOF, a nonsense mutation and the WT for reference. We observed successful donor integration in 75.9% of clones and specific mutations in 56.4% (Fig. 1b). After Cre excision of the LSL cassette, we found comparable p53 protein expression levels in WT and missense mutants, further enhanced by Mdm2 inhibition with Nutlin-3a (N3a) (Fig. 1c and Extended Data Fig. 1d,e). As expected, N3a induced p21/CDKN1A expression and characteristic p53 signatures in WT and pLOF mutant cells, but not in LOF missense or nonsense mutants (Fig. 1c–e and Supplementary Fig. 1). Real-time live-cell imaging confirmed growth inhibition in WT cells, which was diminished by pLOF mutations, and fully abrogated by LOF mutants (Fig. 1f,g and Extended Data Fig. 1f,g). Single-cell RNA sequencing (RNA-seq) further confirmed LOF effects and revealed minimal clonal variability (Extended Data Fig. 2 and Supplementary Note 2).
Notably, we did not observe GOF effects in any of the missense variants under these conditions. The GOF of missense variants, particularly R175H, is best documented for promoting metastasis41,42, and depends on secondary alterations that stabilize the mutant p53 protein as it is inherently unstable in nontransformed cells9,13,43,44. We did not observe constitutive stabilization in our engineered HCT116 cells, and mutant p53 levels remained similar to WT levels in parental HCT116 and other nontransformed cell types (Fig. 1c and Extended Data Fig. 1h). N3a-induced stabilization was significantly lower than that seen in tumor cells with natural TP53 mutations (Extended Data Fig. 1i,j) and insufficient to drive cell migration (Extended Data Fig. 3a–c). However, serial in vivo passaging revealed progressively increasing mutant p53 protein levels (Extended Data Fig. 3d,e), coinciding with increased R175H-dependent migration, invasion and liver metastasis in a subcutaneous xenograft model (Extended Data Fig. 3f–r and Supplementary Note 3).
In conclusion, deleterious TP53 mutations in HCT116 cells immediately caused LOF, increasing proliferation and survival under p53-activating conditions (Fig. 1 and Extended Data Figs. 1 and 2). In contrast, potential GOF effects, as shown for R175H, manifested only after long-term in vivo passaging, promoting migration, invasion and metastasis without impacting proliferative fitness (Extended Data Fig. 3). Therefore, measuring proliferative fitness shortly after mutagenesis, particularly under p53 activation with N3a, effectively captures LOF effects, while minimizing the influence of GOF effects.
R175 mutational scan shows functional diversity in variants
Leveraging the editability of HCT116 LSL/Δ cells, we conducted a mutational scan of codon R175, the most frequently mutated p53 codon in cancer. We generated a library of 27 distinct variants, including missense substitutions, deletions/insertions, and nonsense and silent/synonymous mutations. We co-transfected HCT116 LSL/Δ cells with a TP53-targeting CRISPR–Cas9 nuclease and the R175 variant library, maintaining an average coverage of at least 1,000 independently edited cells per variant (Fig. 2a). Targeted amplicon sequencing validated the editing, confirming that variant distributions in the donor plasmid matched those in the edited cell libraries across biological replicates, even after Cre-induced recombination to activate TP53 variant expression (Fig. 2b–d and Supplementary Table 1). In the absence of treatment, the variant distribution in the Cre-recombined cell libraries remained stable for 8 weeks, with only minor depletion of synonymous variants (Fig. 2e).
Fig. 2: Saturating mutagenesis scan of TP53 codon R175.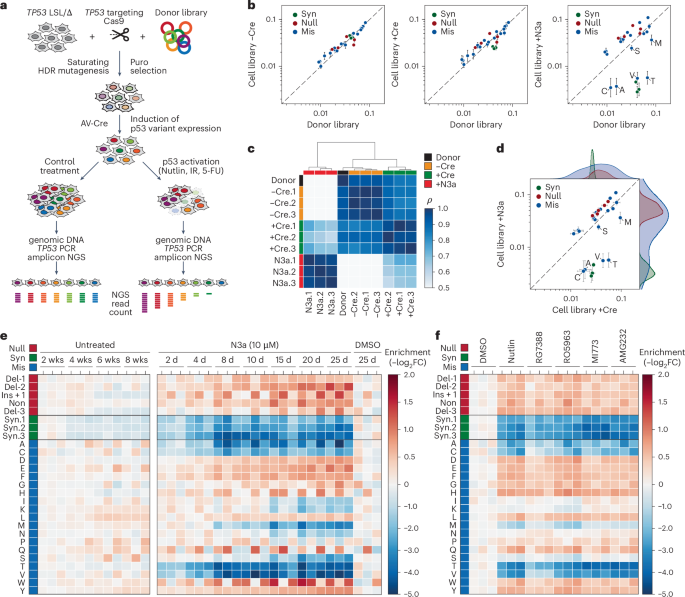
a, Scheme for CRISPR–Cas9-mediated saturating mutagenesis scan via HDR in HCT116 LSL/Δ cell line and analysis of p53-mediated stress responses by NGS. b, Quality control plots illustrating correlation of variant abundance between donor (plasmid) library and variant cell libraries before and after Cre recombination (−Cre and +Cre) and following 8 d of N3a treatment (+N3a). Shown is the mean ± s.d. abundance (n = 3 biological replicates) for synonymous (syn, green), null (red) and missense (mis, blue) variants. Missense variants that are depleted by N3a are individually labeled. Dashed line, line of identity. c, Heatmap showing pair-wise correlation coefficients (ρ, Spearman). Dendrogram shows hierarchical clustering of samples using average linkage and Euclidean distance. d, Quality control plots illustrating correlation of variant abundance between variant cell libraries after Cre recombination (+Cre) and following 8 d of N3a treatment (+N3a). Shown is the mean ± s.d. abundance (n = 3 biological replicates) for synonymous (syn, green), null (red) and missense (mis, blue) variants. Missense variants that are depleted by N3a are individually labeled. Kernel density estimation plots illustrate separation of variant classes following N3a treatment. Dashed line, line of identity. e, Heatmaps showing the temporal changes of variant abundance in the absence or presence of N3a (n = 3 biological replicates per condition). Enrichment or depletion is shown as the −log2 fold change relative to control conditions: the mean of the 2-week untreated samples (left panel) and the 25-d DMSO-treated samples (right panel). f, Response to Mdm2/Mdmx inhibitors. Heatmap of variant enrichment/depletion after 8 d of treatment relative to the mean of the DMSO-treated control replicates (n = 3 biological replicates per condition). del, deletion; ins, insertion; IR, ionizing radiation; 5-FU, 5-fluorouracil; FC, fold change; non, nonsense; wks, weeks.
Upon N3a treatment, we observed a time- and dose-dependent shift in variant distribution (Fig. 2e and Supplementary Fig. 2a). The pattern remained consistent across a range of different Mdm2 and Mdmx inhibitors (Fig. 2f and Supplementary Fig. 2b). Synonymous variants became depleted, while frameshift and nonsense variants—grouped as ‘null’ mutations—were enriched, as expected for LOF mutations. Missense variants showed varied responses, allowing us to classify them into three categories: LOF variants such as R175H, pLOF variants and WT-like variants that behaved similarly to synonymous mutations (Supplementary Fig. 2c). We repeated the scan in H460 lung adenocarcinoma cells and obtained highly correlated results (Extended Data Fig. 4 and Supplementary Note 4), suggesting that the fitness impact of these mutations is conserved across cell types.
Importantly, none of the R175 missense variants significantly enhanced cellular fitness beyond the effect of nonsense mutations, indicating again, at least by this measure, no discernible GOF phenotype. All recurrent R175 variants found in cancer fell into the LOF and pLOF categories, with the most frequent ones uniformly classified as LOF. This demonstrates the mutational scan’s power to correctly identify cancer-associated variants.
We further evaluated the response of R175 variants to different p53-activating stimuli, including DNA damage and nutrient deprivation. We treated the R175 cell library with varying doses of radiation, 5-fluorouracil, starvation in Hank’s balanced salt solution (HBSS) and selective deprivation of glucose or glutamine (Fig. 3a). Under all conditions, the fitness effects mirrored those observed with N3a treatment, although the overall effects were less pronounced (Fig. 3b). This suggests that p53-independent mechanisms diluted the impact of p53 variants under these stress conditions. These results indicate that Mdm2 inhibitors, because of their selectivity for the p53 pathway, more effectively discriminate the functional differences among p53 variants than other p53-activating stimuli.
Fig. 3: Differential impact of R175 variants on stress responses and effector mechanisms.
a,b, Comparison of different stress factors. a, Heatmap showing changes in variant abundance in response to DNA damage (IR, ionizing radiation; 5-FU, 5-fluorouracil) or nutrient starvation (−Glc, glucose starvation; −Gln, glutamine starvation) compared with control treatment with DMSO and N3a. Shown is the enrichment as the −log2 fold abundance change relative to the mean of the controls: unirradiated cells for IR samples, untreated cells for 5-FU samples and unstarved cells in regular growth medium for starvation samples (n = 3 biological replicates per condition). b, Scatter plots illustrating the correlation between enrichment under DNA damage or nutrient deprivation and specific p53 activation with N3a. Shown is the mean ± s.d. enrichment (n = 3 biological replicates). Dashed line, line of identity. c–e, Proapoptotic activity of R175 variants. c, Experimental scheme and a representative FACS scatter plot demonstrating the sorting strategy based on annexin V staining. GFP-negative (neg) cells were gated to selectively analyze cells expressing the p53 variant, that is, cells with successful deletion of the GFP-expressing LSL cassette after AV-Cre infection. d, Heatmap illustrating N3a-induced changes in variant abundance in the annexin V-positive (pos) fraction (left) compared with the entire cell pool (right). Shown is the −log2 fold change (n = 3 biological replicates) relative to the annexin V-negative fraction (left) or DMSO-treated control cells (right). Lanes labeled as ‘16 d–4 d’ represent the difference between the 4 d and 16 d timepoint, reflecting late N3a-induced changes in variant abundance. e, Scatter plot showing the correlation between the early (4 d) and late (between 4 and 16 d) occurring N3a-induced changes in variant abundance versus their enrichment in the apoptotic cell fraction. Shown is the mean ± s.d. enrichment (n = 3 biological replicates) relative to the DMSO-treated control. All scatter plots show the Pearson correlation coefficient ρ with P value approximated using a two-tailed t-distribution and kernel density estimation plots on the side to illustrate the separation of variant classes. Dashed line, line of identity. FACS, fluorescence-activated cell sorting.
Next, we investigated whether known p53-reactivating compounds could rescue the tumor suppressive activity of p53 mutants (Supplementary Fig. 3). We treated the R175-mutant HCT116 cell pools with APR-246 and ZMC1, two compounds that have been reported to restore mutant p53 function45,46. However, neither compound, even when combined with N3a, selectively depleted R175H or other missense variants. This result indicates that these compounds cannot effectively reactivate R175 missense mutants to reduce proliferative fitness, supporting earlier studies that link their therapeutic effects to redox homeostasis rather than direct p53 reactivation47,48,49,50,51.
Moreover, we noted variant-specific differences in response kinetics. Some variants, such as R175T, were rapidly depleted, coinciding with N3a-induced apoptosis, while others, such as R175S, showed slower depletion, likely due to cell-cycle arrest (Fig. 2e). To confirm this, we sorted apoptotic cells based on annexin V staining after 2 and 4 d of N3a treatment (Fig. 3c). Variants that depleted quickly were enriched in the apoptotic fraction (Fig. 3d,e), identifying apoptosis as the crucial mechanism reducing their fitness. In contrast, slowly depleted mutants were absent from the apoptotic fraction, supporting the idea that cell-cycle arrest, rather than apoptosis, drove their depletion. Further experiments with single R175 variants confirmed this: R175T displayed robust apoptosis after N3a treatment, while R175S caused slower growth and increased p21 induction, consistent with cell-cycle arrest (Supplementary Fig. 4). The intermediate depletion kinetics of R175S reflect a separation-of-function phenotype, where the mutation compromises p53’s apoptotic function more than its anti-proliferative activity. Since p53 protein levels heavily influence effector programs—higher levels often shifting the response from cell-cycle arrest to apoptosis52—accurately assessing these phenotypes requires physiologically controlled expression. CRISPR-based mutational scanning provides this control, allowing us to uncover mechanistic differences in variant function within their natural gene-regulatory context.
Deep mutational scan of the p53 DBD
We extended our screen to a comprehensive library of 9,225 variants spanning the p53 DBD from exon 5 to 8 (amino acids 126 to 307), encompassing approximately 94.5% of all cancer-associated missense mutations (Fig. 4a and Supplementary Table 2). The library included all single-nucleotide substitutions (the most common TP53 mutation type), as well as additional missense, nonsense and synonymous variants requiring two- or three-nucleotide changes, single-nucleotide insertions and 1–3-base pair (bp) deletions.
Fig. 4: TP53 DBD variant screen.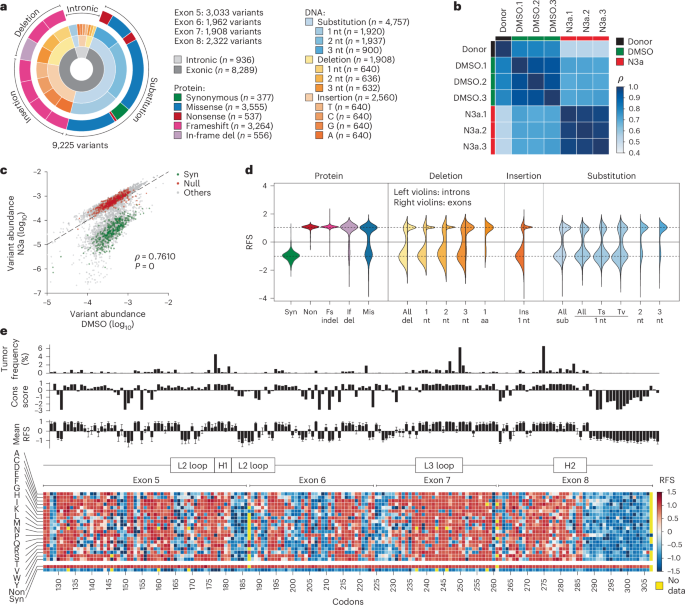
a, Composition of the TP53 DBD mutagenesis library. b,c, Quality control plots. b, Heatmap showing pair-wise correlation coefficients (ρ, Spearman) between sample replicates. c, Scatter plot illustrating separation of variants under p53-activating N3a treatment. Shown is the median abundance of all variants under N3a versus DMSO treatment (n = 3 biological replicates). Synonymous (syn) and nonsense (non) variants highlighted in green and red, respectively. ρ, Spearman correlation coefficient with P value approximated using a two-tailed t-distribution. Dashed line, line of identity. d, Distribution of RFSs for different variant classes. Left violin half shows distribution for intronic, right violin half for exonic variants. e, Heatmap showing the RFS for all mis, syn and non variants. Bar plots show for each codon the mutation frequency in the UMD TP53 mutation database, the evolutionary conservation score and the RFS (mean ± s.d.) of all missense substitutions at this position. Fs, frameshift; if, in-frame; indel, insertion or deletion; nt, nucleotide; sub, substitution; Ts, transition; Tv, transversion.
To overcome sequencing limitations, we divided the library into four sub-libraries, each covering a single exon with flanking intronic sequences, following previously published methods27,53. We co-transfected HCT116 LSL/Δ cells with the TP53-targeting Cas9 and each sub-library, followed by selection and Cre-induced activation of mutant expression. After treating cells with N3a or dimethyl sulfoxide (DMSO, as solvent control) for 8 d, we extracted genomic DNA, amplified the edited exon by PCR and analyzed variant frequencies by next-generation sequencing (NGS) (Extended Data Fig. 1a and Supplementary Table 2). We maintained coverage of at least 500 individually edited cells per variant, across three biological replicates. Control mutations, including nonsense (LOF) and synonymous (WT-like) variants, showed no notable abundance differences, confirming efficient donor library introduction without TP53-related bias (Fig. 4b and Extended Data Fig. 5a,b).
Following N3a treatment, the variant distribution shifted substantially, indicating functional differences. The correlation between the donor plasmid and cell libraries was strong for the control treatment but weakened markedly after N3a treatment (Fig. 4c and Extended Data Fig. 5a). Synonymous variants were depleted, while nonsense and frameshift mutations were enriched, creating a bimodal distribution that effectively separated LOF from WT-like variants (Extended Data Fig. 5b).
We standardized results across exons by converting enrichment scores (ESs) into relative fitness scores (RFSs), ranging from −1 (synonymous mutations) to +1 (nonsense mutations) (Fig. 4d and Extended Data Fig. 5c,d)27. Frameshift variants exhibited uniformly positive RFS values, similar to nonsense controls. In-frame deletions of three consecutive base pairs also yielded high RFS values, highlighting the sensitivity of the p53 DBD to even single amino acid deletions. Substitution variants showed more variable effects, with transversions generally having a stronger impact than transitions. Overall, 55.2% of substitution variants displayed positive RFS values, indicating at least partial functional impairment of p53. Conversely, most intronic variants had negative RFS values, indicating preserved tumor suppressor activity.
We systematically replaced each residue with every possible amino acid to assess missense mutations (Fig. 4e). The screen returned reliable RFS values for 99% of the possible 3,458 missense variants, making it one of the most comprehensive studies of DBD variants to date (Supplementary Fig. 5). Missing variants mostly mapped to exon boundary-spanning codons (for example, G187, S261, A307) that were excluded from the library design since they could not be generated within a single exon. Hierarchical clustering by RFS values differentiated codons according to their vulnerability (Extended Data Fig. 5e,f). Hotspots such as G245, R248 and R249 were highly vulnerable to any substitution, while others such as R175 and R282 showed variable impairment depending on the amino acid change. Substitutions with biochemically similar amino acids clustered together based on functional effects, confirming that mutations with similar biochemical properties tend to cause less damage.
Mapping the median RFS values onto the three-dimensional protein structure revealed a significant correlation between higher RFS values and proximity to the DNA-binding surface (Fig. 5a and Extended Data Fig. 5g). Residues critical for stabilizing the hydrophobic core also showed high RFS values, while solvent-exposed residues were more tolerant to mutations (Extended Data Fig. 5g–i). Notably, residues involved in DNA contact (for example, R248) and those at the inter-dimer interface (for example, G199) were highly sensitive to mutations.
Fig. 5: RFS correlates with protein structure, mutation frequency and evolutionary conservation.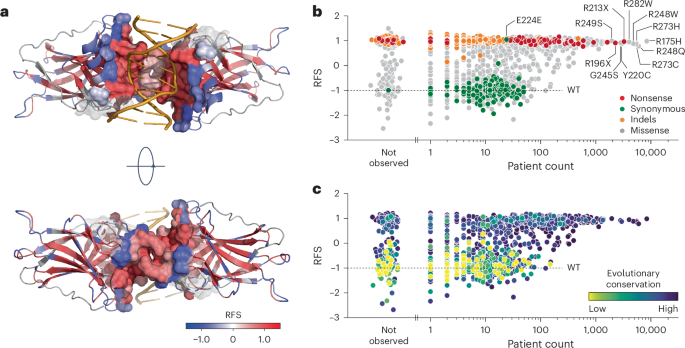
a, Structure of a DNA-bound p53 DBD dimer colored by RFS (PDB 3KZ8 (ref. 83)). The DBD-DNA and intra-dimer interaction interface within a distance of 10 Å is shown as a sphere model and superimposed on the cartoon model to highlight its sensitivity (red color, positive RFS values) to mutation. b,c, Scatter plots showing the correlation between RFS and aggregated variant count in patients with cancer listed in the UMD, IARC/NCI, TCGA and GENIE databases. Variants are colored by the indicated mutation types (b) or evolutionary conservation (c).
We compared our RFS values with the prevalence of over 150,000 TP53 mutations in major cancer databases (Supplementary Table 3 and Supplementary Note 5). The most frequent hotspot mutations, nonsense and indel mutations, as well as other missense mutations with a patient count above 100, exhibited high RFS values, suggesting strong positive selection during tumorigenesis (Fig. 5b and Extended Data Fig. 6a). In contrast, missense variants with WT-like RFS values showed lower patient counts, resembling synonymous mutations and benign polymorphisms54, likely representing passenger mutations. The strong correlation between codon-level RFS values and evolutionary conservation scores further confirmed that residues with high RFS values are under strong evolutionary selection (Fig. 5c, Extended Data Fig. 5j and Supplementary Table 4).
We observed a large number of high RFS missense mutations at evolutionarily conserved residues that were rarely or never reported in patients (Fig. 5b,c). Many of these variants were two- or three-nucleotide substitutions or single-nucleotide transversions, which are all less frequent in cancer cells compared with transitions (Extended Data Fig. 6a–h)55. When comparing variants with similar mutational probabilities based on COSMIC mutational signatures56 (Extended Data Fig. 6i–l and Supplementary Table 5), those with a positive RFS consistently had significantly higher patient counts (Extended Data Fig. 6k,l). Thus, a positive RFS robustly identifies LOF variants under positive selection during tumor development.
We further assessed the ability of the RFS to classify variant pathogenicity using 1,256 ClinVar variants (≥1* review status, Supplementary Table 6)57. The RFS not only effectively distinguished nonsense from synonymous variants (Extended Data Fig. 5d), but also pathogenic from benign variants, achieving a precision–recall curve with an area under the curve of 0.999, an F1 score of 0.990, a precision/positive predictive value of 0.988 and a recall/sensitivity of 0.993 (Extended Data Fig. 7). Using ClinVar ≥1* variants as truth sets of pathogenic and benign variants58,59, the RFS accurately classified >99% (398 of 401) of pathogenic/likely pathogenic controls as functionally abnormal and >98% (248 of 253) of benign/likely benign controls as functionally normal. The corresponding odds of pathogenicity (OddsPath) values were 50.2 and 0.0076, respectively, providing strong evidence for pathogenic (PS3) and benign (BS3) variant assessments according to the American College of Medical Genetics and Genomics (ACMG) and the Association for Molecular Pathology (AMP) guidelines58,60,61. This strength of evidence was consistent even with higher stringency thresholds, including ClinVar variants with two or more stars (Extended Data Fig. 7 and Supplementary Table 6).
Increased sensitivity of CRISPR-based deep mutational scan for subtle LOF
We compared our CRISPR-based deep mutational scan with previous studies using lentiviral overexpression of mutant cDNA libraries18,20, converting all data to RFS values (Fig. 6a and Supplementary Table 7). The CRISPR screen provided better separation between positive and negative controls, clearly distinguishing cancer-associated missense mutations from single-nucleotide variants (SNVs) not linked to cancer. In contrast, the cDNA screens showed substantial overlap between these groups, likely due to variable mutant expression from random genome integration of lentiviral constructs.
Fig. 6: CRISPR screen reveals pLOF variants.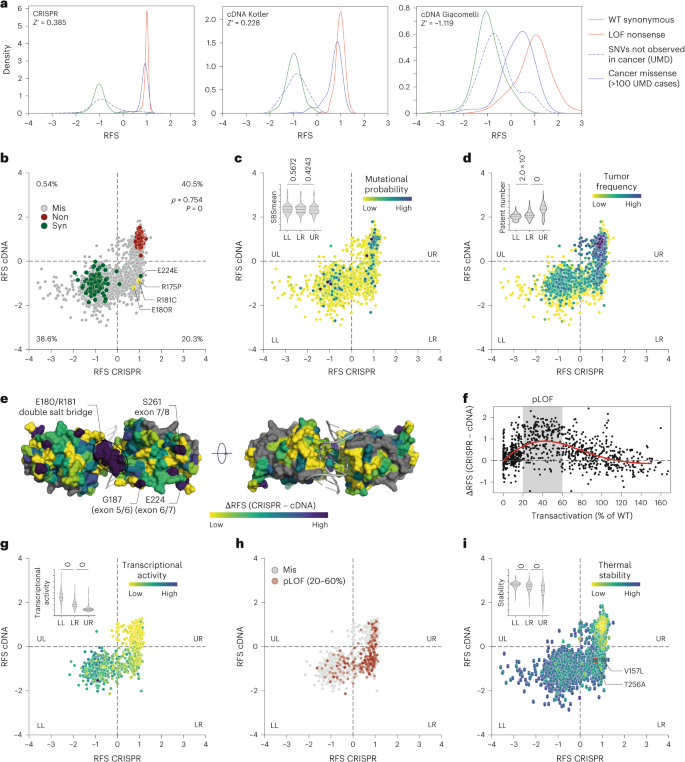
a, Kernel density estimation plots showing the distribution of RFS scores for the indicated groups of variants in the CRISPR versus cDNA-based variant screens18,20. All results from previously reported cDNA screens were transformed to RFS by scaling the median of nonsense mutations to +1 and the median of synonymous mutations to −1. Z′ factors, a measure of statistical effect size, are stated as a quality parameter for the assay’s ability to separate positive (LOF nonsense) and negative (synonymous) controls. b–d, Scatter plots illustrating correlation between RFS values obtained by CRISPR mutagenesis and cDNA overexpression20. Variants are categorized into four quadrants (LL, lower left; LR, lower right; UL, upper left; UR, upper right). Percentage of variants in each quadrant is given in b. ρ, Spearman correlation coefficient with P value approximated using a two-tailed t-distribution. Variants are colored by mutation type (b), average mutational probability (SBSmean) (c) or frequency in patients with cancer (d). Inserted violin plots illustrate the value distribution in the three main quadrants. e, Structure of a DNA-bound p53 DBD dimer (PDB 2AHI (ref. 84)) colored by the difference in RFS between the CRISPR and cDNA screen. Selected areas of high discrepancy are labeled. f, Scatter plot of the difference between CRISPR and cDNA screen versus the mean transcriptional activity of variants relative to WT p53 as measured in a yeast-based reporter system17. The area of 20–60% transcriptional activity (pLOF) is shaded in gray; red line, cubic spline curve. g–i, Scatter plots showing the correlation between RFS values obtained by CRISPR mutagenesis and cDNA overexpression. Variants are colored by transcriptional activity17 (g), classification as pLOF (h) or thermal stability as predicted by HoTMuSiC67 (i). V157L and T256A are highlighted in i with red outline and increased dot size. Inserted violin plots illustrate the value distribution in the three main quadrants. All violin plots show P values from one-way ANOVA and a post hoc multiple comparisons test by Tukey.
When comparing the CRISPR results with the cDNA-based study in ref. 20, both screens classified most variants similarly, but 20.3% of missense variants were differentially classified as LOF by CRISPR and WT-like by cDNA screening (Fig. 6b, lower-right quadrant). These lower-right variants had similar mutational probabilities but showed significantly higher patient counts than WT-like variants, suggesting positive selection during tumorigenesis (Fig. 6c,d and Extended Data Fig. 8).
Several lower-right variants, such as R175P, R181C and E180R, are tumorigenic in mice with a (partial) LOF phenotype62,63,64. Moreover, a notable region of discordant RFS values between the CRISPR and cDNA screen mapped to the intra-dimer interface, where mutations often cause pLOF effects65 (Fig. 6e). To further validate CRISPR’s sensitivity for detecting subtle LOF phenotypes, we compared the CRISPR RFS values with transcriptional activity from the yeast reporter assay in ref. 17, which is a gold standard for assessing the clinical impact of TP53 variants66. A moderate but highly significant negative correlation confirmed that positive RFS values are associated with low transcriptional activity (Supplementary Fig. 6). Variants with residual 20–60% of WT transcriptional activity showed the largest differences between CRISPR and cDNA RFS values (Fig. 6f–h and Supplementary Table 7), further confirming the superior sensitivity of the CRISPR screen. All these observations were confirmed in a comparison with the cDNA screen in ref. 18 (Supplementary Fig. 7).
An analysis of protein stability estimates by HoTMuSiC67 demonstrated that lower-right variants had higher thermal stability than upper-right quadrant LOF variants but lower stability compared with WT-like variants (Fig. 6i), indicating moderate destabilization that may impair function not as severely and irreversibly as in complete LOF variants. Two lower-right cancer variants, V157L and T256A, showed reduced thermostability in differential scanning fluorimetry assays but were less destabilized than other more frequent mutations (Supplementary Table 8). When introduced into HCT116 LSL/Δ cells by CRISPR-HDR, both mutations rendered cells resistant to N3a, similar to R175H and R175X (Supplementary Fig. 8). However, at 32 °C, responsiveness to N3a was restored, indicating moderate p53 destabilization. In addition, both variants were stabilized by arsenic trioxide, which allosterically reactivates several temperature-sensitive structural mutants68,69 (Supplementary Table 8).
These findings highlight that even a subtle loss of p53 function from mild thermodynamic destabilization can clearly enhance proliferative fitness. This effect, missed by conventional cDNA expression screens, was correctly detected by the CRISPR screen, uncovering a set of dysfunctional missense variants with moderate destabilization and potential for pharmacological rescue.
Widespread splicing alterations and NMD
DMS studies using cDNA overexpression are blind to mutation effects on RNA splicing, which can result in LOF through NMD. In our CRISPR-based screen, 55 of 56 previously reported splice-altering TP53 variants were enriched under N3a treatment, displaying positive RFS values indicative of LOF (Supplementary Table 9). Moreover, the most pronounced differences between the CRISPR and cDNA screens mapped to poorly conserved residues near exon boundaries (for example, G187, E224, V225 and S261), suggesting splicing disruption (Figs. 6e and 7a).
Fig. 7: Splicing and NMD.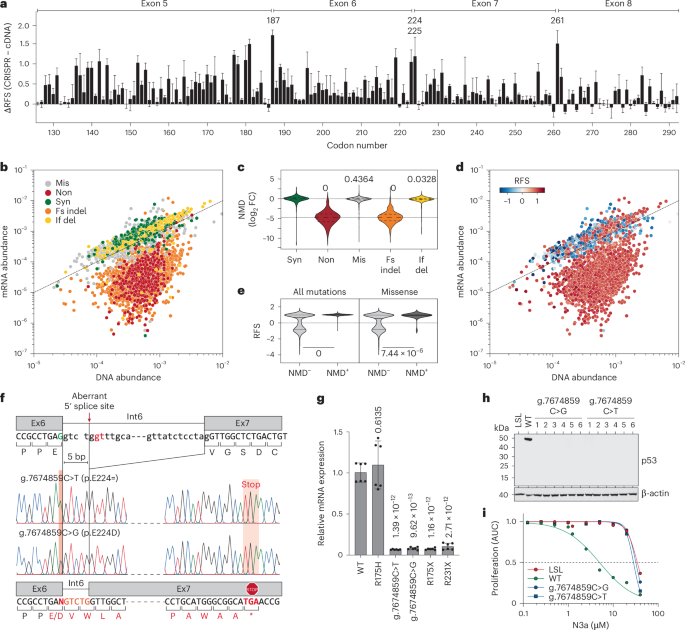
a, Bar plot demonstrating large differences between CRISPR and cDNA screening results at exon borders (residues G187, E224, V225 and S261). Shown is the mean difference (±s.d.) of all missense variants at each codon. b,d, Scatter plots comparing the abundance of variants in the cell libraries at the level of genomic DNA and mRNA. Each dot represents the median abundance of a variant from n = 3 biological replicates. Variants are colored by mutation type (b) and by RFS (d). Dashed line, line of identity. c, Violin plot showing NMD as the log2 fold change in abundance at mRNA and DNA level by mutation type. One-way ANOVA with multiple comparison by Tukey. e, Distribution of RFS values in variants (all or missense) according to NMD status. Variants with a log2 fold change in abundance between mRNA and DNA +. Two-sided Mann–Whitney test. f–i, LOF and NMD caused by g.7674859C>T (p.E224=) and g.7674859C>G (p.E224D) variants. f, Aberrant mRNA splicing revealed by Sanger sequencing of cDNA. g, Quantitative PCR with reverse transcription (RT–PCR) of indicated HCT116 mut/Δ cells. Shown is the TP53 mRNA expression relative to WT as mean ± s.d. (n = 6 replicates). One-way ANOVA with Dunnett’s multiple comparisons test. h, Western blot demonstrating lack of p53 protein expression in multiple HCT116 cell clones with g.7674859C>T/G variants. i, Resistance of g.7674859C>T/G clones to N3a. Proliferation was analyzed by real-time live-cell imaging. Shown is the area under the proliferation curve relative to untreated. p53-null (LSL, red) and WT (green) are shown as reference.
We sequenced cDNA from the cell libraries and correlated the abundance of variants at the cDNA level with their corresponding abundance in the genome (Fig. 7b, Supplementary Table 10 and Supplementary Note 6). Variants causing frameshift mutations in exons 5–8 led to premature termination codons, triggering NMD. Nonsense and frameshift mutations were significantly underrepresented at the mRNA level by ~30-fold (Fig. 7c–e). Additionally, several missense mutations near exon–intron junctions showed reduced mRNA levels and LOF, indicating splicing defects (Extended Data Fig. 9a,b). While many are rare double- or triple-nucleotide substitutions, some of these mutations, such as at codons G187, E224 and S261, are prevalent in cancer but had been classified as WT-like in all cDNA screens17,18,20. In our CRISPR screen, they were identified as LOF due to splicing defects (Extended Data Fig. 9c,d). To validate this, we introduced ‘E224D’ (NC_000017.11:g.7674859C>G) and ‘E224=’ (NC_000017.11:g.7674859C>T) into HCT116 LSL/Δ cells. Both mutations altered splicing, causing frameshift and premature termination, subjecting the mRNA to NMD and preventing p53 protein production (Fig. 7f–h), thereby rendering the cells resistant to N3a (Fig. 7i).
We also observed LOF variants in noncoding, exon-flanking intronic regions likely due to altered splicing. All mutations affecting the invariant GT and AG dinucleotides at intron ends resulted in LOF (Supplementary Fig. 9). SNVs at position 5 of intron 5 also had a deleterious impact, while similar substitutions in introns 6–8 were tolerated. The NC_000017.11:g.7673847A>C mutation in the 3′ region of intron 7, reported in a patient with pancreatic adenocarcinoma70, caused aberrant splicing, leading to an in-frame insertion of three amino acids (Extended Data Fig. 9e,f). Unlike cDNA-based screens, the CRISPR screen therefore accurately discriminated functionally normal from abnormal variants in these intronic regions.
We also noted reduced mRNA levels for NC_000017.11:g.7675202A>T, encoding the missense variant L137Q, and for NC_000017.11:g.7674934T>A, encoding the synonymous variant G199=, suggesting splicing defects (Extended Data Fig. 9). While two other silent substitutions at the same position, NC_000017.11:g.7674934T>G/C, showed normal mRNA levels, g.7674934T>A and g.7675202A>T created cryptic splice sites, leading to aberrant transcripts. In HCT116 and H460 cells, both variants lacked an anti-proliferative response to N3a and failed to induce p21 (Fig. 8a–d and Extended Data Fig. 10a–d). Sequencing revealed exon skipping and truncated transcripts (Fig. 8e–i and Extended Data Fig. 10e–i). The g.7674934T>A variant produced transcripts with premature termination codons, preventing p53 protein expression, while g.7675202A>T generated a shortened p53 protein with an in-frame deletion of amino acids 126–-137, despite being been classified as WT-like in cDNA screens.
Fig. 8: Aberrant splicing due to exonic SNVs causes LOF.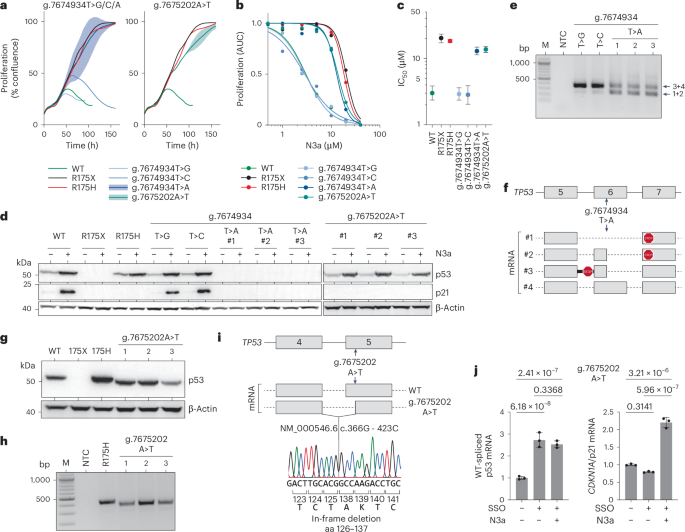
a–c, Impact of codon 199 (NC_000017.11:g.7674934T>A/C/G) and codon 137 (NC_000017.11:g.7675202A>T) variants on the anti-proliferative activity of N3a in HCT116 cells. WT, missense (R175H) and nonsense (R175X) variants are shown for comparison. a, Proliferation in the presence of 10 µM N3a analyzed by real-time live-cell imaging. For the g.7674934T>A and g.7675202A>T genotypes, plots show the mean ± s.d. of n = 3 independent clones. b, Dose–response curves. Shown is the area under the proliferation curve (AUC) relative to untreated. c, IC50 (with 95% CI). d, Western blot demonstrating mutant p53 and p21 protein expression in independent HCT116 clones in the absence and presence of N3a. e,f, cDNA analysis of g.7674934T>A/C/G clones. e, Agarose gel electrophoresis of RT–PCR products. f, Scheme of mRNA transcripts detected by Sanger sequencing of RT–PCR amplicons. g, Western blot demonstrating reduced size of p53 protein in HCT116 clones with the g.7675202A>T genotype. h,i, cDNA analysis of g.7675202A>T clones. h, Agarose gel electrophoresis of RT–PCR products. i, Sequencing analysis of RT–PCR amplicons showing an in-frame deletion of 12 amino acids. j, Quantitative RT–PCR specific for the regularly spliced p53 and CDKN1A/p21 mRNA in HCT116 g.7675202A>T cells transfected with SSO and treated with N3a as indicated. Shown is the mRNA expression relative to untreated as mean ± s.d. (n = 3 replicates); two-way ANOVA with Tukey’s multiple comparisons test. M, DNA size marker; NTC, no template control.
To explore the potential for correcting such splice defects, we used SSOs71 designed to block the cryptic 3′ splice site in exon 5 created by the g.7675202A>T variant (Fig. 8j and Extended Data Fig. 10j). SSO transfection significantly increased the levels of the regularly spliced p53 mRNA and promoted p21 induction by N3a. This confirms that the LOF of the g.7675202A>T variant arises from aberrant splicing, not from a non-functional L137Q protein, and demonstrates proof-of-principle that cancer-associated p53 splice aberrations can be corrected using SSO technology. However, g.7675202A>T and g.7674934T>A were the only SNVs outside exon/intron borders to cause more than twofold mRNA reduction and LOF (Extended Data Fig. 9a), despite 355 other missense or synonymous SNVs creating cryptic splice sites. Thus, splice aberrations caused by exonic SNVs are less common than anticipated.