Prevalence of RASGRF fusions in solid tumor malignancies
We previously reported three RASGRF1 fusions: (1) an OCLN–RASGRF1 fusion in an otherwise driver-negative lung adenocarcinoma from an individual with no smoking history, (2) an SLC4A4–RASGRF1 fusion in a KRAS wild-type human PDAC cell line, and (3) an IQGAP1–RASGRF1 fusion from a giant cell sarcoma characterized in The Cancer Genome Atlas (TCGA)21. Five additional RASGRF1 fusions have also been reported from NSCLC (TMEM87A-RASGRF1)19, acute myeloid leukemia (TMEM154-RASGRF1)23, melanoma (ABC22-RASGRF1)20, and melanocytic neoplasms with spitzoid features (CD63-RASGRF1 and EHBP1-RASGRF1)20. In addition, five RASGRF2 fusions have been identified in melanoma and melanocytic proliferations, including ATP2B4–RASGRF2 (n = 3) and ERBIN–RASGRF2 (n = 2), although no functional characterization of RASGRF2 fusions has been described22.
To gain insight into the frequency and structural characteristics of RASGRF fusions, we queried 132,158 tumors with RNA-seq data from the Tempus real-world multimodal database. Diverse solid tumor malignancies were represented, with lung, colorectal, breast, pancreatic, and prostate cancers comprising approximately half of the samples (Supplementary Fig. 1). RASGRF fusions were initially detected in 639 RNA samples. These were subjected to rigorous filtering processes to exclude potential technical artifacts, resulting in 88 well-supported RASGRF fusions (Fig. 1a). Tumors with at least 6 sequencing reads spanning the fusion endpoints (n = 59) were considered for further evaluation. We next examined these fusions to identify those that preserved the catalytic CDC25 domain responsible for RAS nucleotide exchange. Eleven fusions lacked an intact CDC25 domain, leaving 48 fusions. Two of the 48 fusions were eliminated from further consideration, as one did not appear to involve a coding 5’ gene, and the other fusion included intronic sequence. Of the 46 remaining fusions, 6 were not predicted to preserve the open reading frame of the rearranged genes, and their functional significance is unknown (Supplementary Table 1). The remaining 40 in-frame fusions were considered candidate functional RASGRF fusions (Supplementary Table 2). Half of the 40 fusions were identified in NSCLC, PDAC, and melanoma, with the remainder found in other solid tumor malignancies (Fig. 1b). In this dataset, RASGRF fusions had the highest frequency in melanoma (0.15%) and occurred in 1c).
Fig. 1: Identification of RASGRF fusions.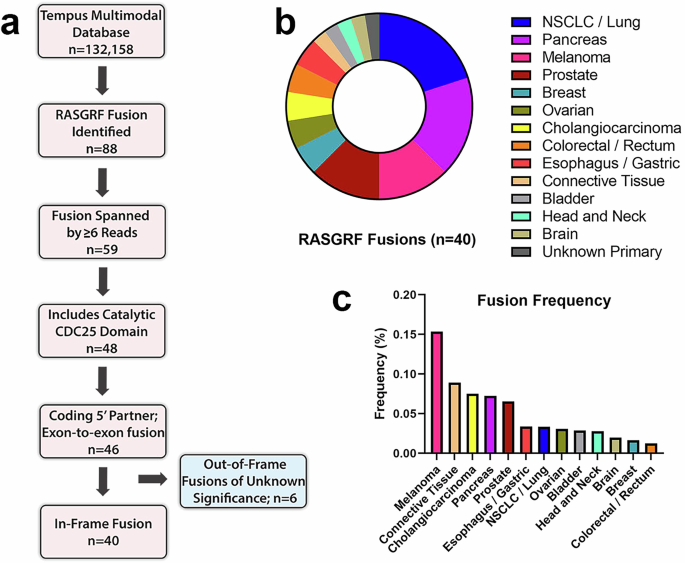
a Schematic overview of the approach to identify RASGRF fusions. b Tumor types from which RASGRF fusions were identified. c Frequency of RASGRF fusions across tumor types.
Genomic structure of identified RASGRF1 and RASGRF2 fusions
We identified 17 RASGRF1 fusions, including 5 in NSCLC, 3 in melanoma, and 1 in PDAC (Fig. 2a, b). Some were identified from tumors in which RASGRF1 fusions have not previously been reported, including cholangiocarcinoma, colorectal, gastroesophageal, and bladder cancers. The 17 fusions each contain a unique 5’ fusion partner, including three (IQGAP1, OCLN, and TMEM87A) previously identified in other RASGRF1 fusions (Fig. 2c). The TMEM87A-RASGRF1 fusion identified from a gastroesophageal malignancy shares the same fusion endpoints as a previously reported TMEM87A-RASGRF1 fusion from NSCLC19. We previously reported an OCLN–RASGRF1 fusion from an NSCLC and an IQGAP1–RASGRF1 fusion from a sarcoma21. These differ in their fusion endpoints from the OCLN–RASGRF1 and IQGAP1–RASGRF1 fusions reported here from a cholangiocarcinoma and a melanoma, respectively (although the segment of OCLN in both OCLN–RASGRF1 fusions is the same).
Fig. 2: Structural diversity of RASGRF fusions.
a Functional domains of wild-type RASGRF1 (top) and 17 identified RASGRF1 fusions. Tumor type for each fusion is indicated by the colored bars on the right (using the color scheme in Fig. 1). PH1 pleckstrin homology domain 1, CC coiled coil domain, IQ isoleucine–glutamine domain, DH dbl-homology region, PH2 pleckstrin homology domain 2, REM Ras-exchanger stabilization motif domain. b Tumor types from which RASGRF1 fusions were identified. Tumor type for each fusion is indicated by the colored bars on the right. c Frequency of 5’ fusion partners among the 17 RASGRF1 fusions. 5’ partners indicated in red have been previously reported in other RASGRF1 fusions. d Functional domains of wild-type RASGRF2 (top) and 23 identified RASGRF2 fusions. e Tumor types from which RASGRF2 fusions were identified. f As in c, except for RASGRF2 fusions. g Fraction of intrachromosomal and extrachromosomal RASGRF fusions. h Circos plot demonstrating chromosomal location of RASGRF1, RASGRF2, and identified fusion partners.
We identified 23 RASGRF2 fusions (Fig. 2d). To our knowledge, RASGRF2 fusions have previously been reported only in melanoma and melanocytic proliferations22. We identified six RASGRF2 fusions in PDAC, five in prostate cancers, and three in NSCLC/lung cancers (Fig. 2e). Additional RASGRF2 fusions were found in other solid tumor malignancies including melanoma and ovarian cancer. Among the 23 RASGRF2 fusions, we identified 13 distinct 5’ fusion partners (Fig. 2f). Three of these have been previously reported in other RASGRF fusions (OCLN and SLC4A4 in RASGRF1 fusions and ERBIN in RASGRF2 fusions)20,21.
In total, among the 40 identified fusions, there were 29 unique 5’ fusion partners, including 24 not previously reported. Only 3 of the 29 fusion partners were identified in more than one fusion. These include FARP1 (found in 2 RASGRF2 fusions from cholangiocarcinoma and PDAC) and MSH3 (found in 6 RASGRF2 fusions from colorectal, ovarian, head and neck, pancreatic, and prostate cancers; Fig. 2f). In addition, OCLN was the fusion partner in a RASGRF1 fusion from cholangiocarcinoma, 5 RASGRF2 fusions from PDAC and NSCLC, and was previously reported in another RASGRF1 fusion from NSCLC by our group21. OCLN encodes the tight junction transmembrane protein occludin. In all 6 fusions involving OCLN (and in the OCLN–RASGRF1 we previously reported), the fusion endpoint occurs within the C-terminal cytoplasmic tail of occludin. MSH3 was the most common RASGRF2 fusion partner, identified in 6 fusions. Over half of RASGRF1 and RASGRF2 fusions arose from intrachromosomal gene rearrangements (Fig. 2g, h). The relatively high frequency of RASGRF2 fusions involving MSH3 may be due to the location of MSH3 immediately proximal to RASGRF2 on chromosome 5q (Fig. 2h). Two genes (OCLN and SLC4A4) have been identified as fusion partners in both RASGRF1 and RASGRF2 fusions (with SLC4A4–RASGRF1 previously reported by our group in PDAC)21.
Demographic features and co-occurring genetic alterations
Among subjects with tumors harboring RASGRF fusions, the median age at diagnosis was 67 years, ranging from age 28–82 (Table 1; Fig. 3). One subject’s age was unknown. Of note, 26 of 40 tumors (65%) with RASGRF fusions occurred in males (Table 1; Fig. 3). Most individuals with tumors harboring RASGRF fusions were Caucasian, although information about race was not available for 14 subjects (Table 1; Fig. 3). Eight subjects were never-smokers, while 22 were current or former smokers. Smoking history was not available for the other 10 subjects. Among individuals with NSCLC/lung cancers harboring RASGRF fusions, 2 were never-smokers while 6 were current or former smokers (Fig. 3; Supplementary Table 3; Supplementary Fig. 2). The NPTN-RASGRF1 and RP2-RASGRF1 fusions were identified in NSCLCs from the 2 never-smokers (Supplementary Fig. 2). Most fusions were identified in tumors from individuals with Stage IV malignancy, although staging information was not available for 14 subjects (Table 1; Fig. 3).
Fig. 3: Co-mutation plot of tumors harboring RASGRF fusions.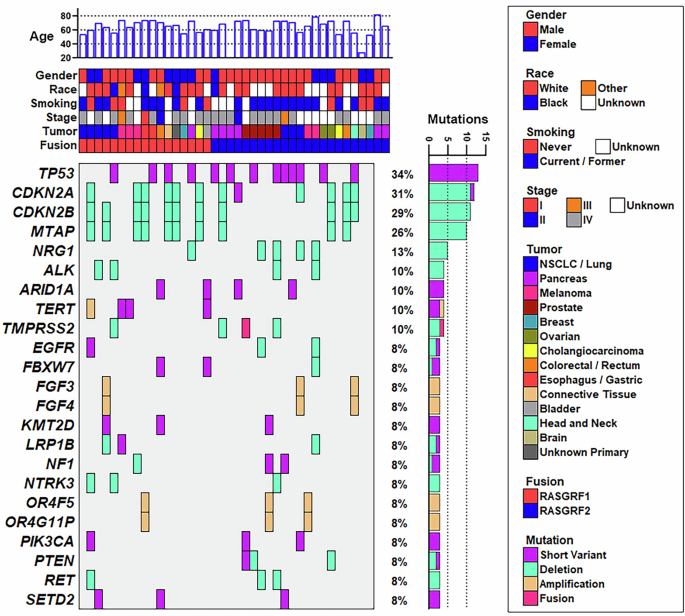
Available demographic and co-mutation data are shown for the 40 tumors identified in this study that harbor in-frame RASGRF fusions. Each column represents a tumor. Genes with co-occurring alterations in at least 3 of the 40 tumors are shown. Co-occurring alterations include somatic pathogenic/likely pathogenic short variant alterations, copy number deletions, copy number amplifications, and fusions. Co-mutation data were not available for 2 of the 40 tumors (shown in the far right), which were subjected to RNA-seq but not DNA sequencing. One pancreatic tumor harboring a RASGRF2 fusion was obtained from a patient of unknown age (corresponding to the sample with no age displayed at the top of the figure).
Table 1 Demographic features of subjects with RASGRF fusions
We reviewed histologic subtypes of NSCLC/lung cancers with RASGRF fusions. The data were ascertained from abstracted clinical records (including pathology reports) and were not independently verified. Five of the eight NSCLC/lung cancers harboring a RASGRF fusion were adenocarcinomas (corresponding to the NSCLCs containing PACSIN2-RASGRF1, DLG1-RASGRF1, RP2-RASGRF1, NPTN-RASGRF1, and OCLN–RASGRF2; Supplementary Fig. 2). The NSCLC with PIAS1-RASGRF1 was a squamous cell carcinoma, while HSPA4-RASGRF2 was identified in a large cell neuroendocrine carcinoma of the lung. The histologic subtype of the NSCLC containing TOM1L2-RASGRF2 is unknown.
We examined co-occurring gene alterations in tumors with RASGRF fusions (Fig. 3). DNA sequencing data were available for 38 of the 40 tumors with RASGRF fusions (data were unavailable from the PDAC harboring FARP1-RASGRF2 and from one of the PDACs with OCLN–RASGRF2). Many of the identified co-occurring alterations are common in cancer. Thirteen tumors with RASGRF fusions had TP53 alterations. Loss of CDKN2A, CDKN2B, and/or MTAP on chromosome 9p was observed in 12 tumors. TERT alterations were found in 4 tumors. Genetic alterations involving other regulators or downstream effectors of RAS signaling were also noted (NF1, PIK3CA, PTEN).
We examined whether RASGRF fusions might be enriched in melanoma, PDAC, and NSCLC/lung cancers lacking established oncogenic drivers in these tumor types. Among 5 melanomas with RASGRF fusions in our dataset, none had co-occurring BRAF or NRAS alterations (which are found in ~50–60% and ~15–25% of melanomas, respectively; Supplementary Fig. 2)24,25. Activating KRAS mutations are identified in >90% of PDACs26. Among 7 PDACs with a RASGRF fusion, only one (with an MSH3-RASGRF2 fusion) harbored a co-occurring KRAS mutation (G12D; Supplementary Fig. 2). Eight lung cancers were found to have a RASGRF fusion. One NSCLC with an NPTN-RASGRF1 fusion also harbored both a classic activating EGFR Exon 19 deletion and an ADPGK-NTRK3 fusion, both established oncogenic drivers in NSCLC (Supplementary Fig. 2). Of note, this patient had previously been treated with the EGFR inhibitor osimertinib at the time of sample acquisition, raising the possibility that the NPTN–RASGRF1 and ADPGK–NTRK3 fusions could represent acquired mechanisms of resistance to osimertinib. Unfortunately, a sample from this patient’s tumor prior to osimertinib administration was not available to determine if the fusions were present at that time. Known oncogenic drivers were not identified in the other seven NSCLC/lung cancers with a RASGRF fusion.
Plasma membrane localization enhances RAS activation mediated by RASGRF fusions
Seven of 17 RASGRF1 fusions (41%) and 7 of 23 RASGRF2 fusions (30%) identified in this study include transmembrane N-terminal fusion partners with the fusion endpoint predicted to occur within the cytoplasm. Among eight previously reported RASGRF1 fusions, six contain a membrane-spanning N-terminal fusion partner19,20,21. In addition, three of the five previously reported RASGRF2 fusions also involve a transmembrane fusion partner22. As membrane association is required for RAS activation, we hypothesized that membrane localization of RASGRF fusions may facilitate RAS activation by bringing the catalytic RAS-GEF domain in proximity with membrane-associated RAS. We tested this by evaluating the effect of (1) disrupting plasma membrane localization of a membrane-spanning RASGRF1 fusion and (2) forcing membrane localization of wild-type RASGRF1 and a RASGRF1 fusion without a transmembrane N-terminal partner.
We previously showed that an OCLN–RASGRF1 fusion (which includes all four transmembrane domains of occludin) localizes to the plasma membrane when ectopically expressed in HEK 293 T cells21. Amino acid deletions within the 4th transmembrane domain (TM4) of occludin abolish plasma membrane localization27. We used site-directed mutagenesis to delete a 5-amino acid segment of TM4 in OCLN–RASGRF1 (OCLN–RASGRF1 del255–259; see Methods and Supplementary Table 4). We used live cell imaging with confocal microscopy to confirm that this alteration disrupts plasma membrane localization of ectopically expressed, GFP-tagged OCLN–RASGRF1 in HEK 293 T cells (Fig. 4a).
Fig. 4: Effect of membrane localization of RASGRF1 fusions on RAS activation.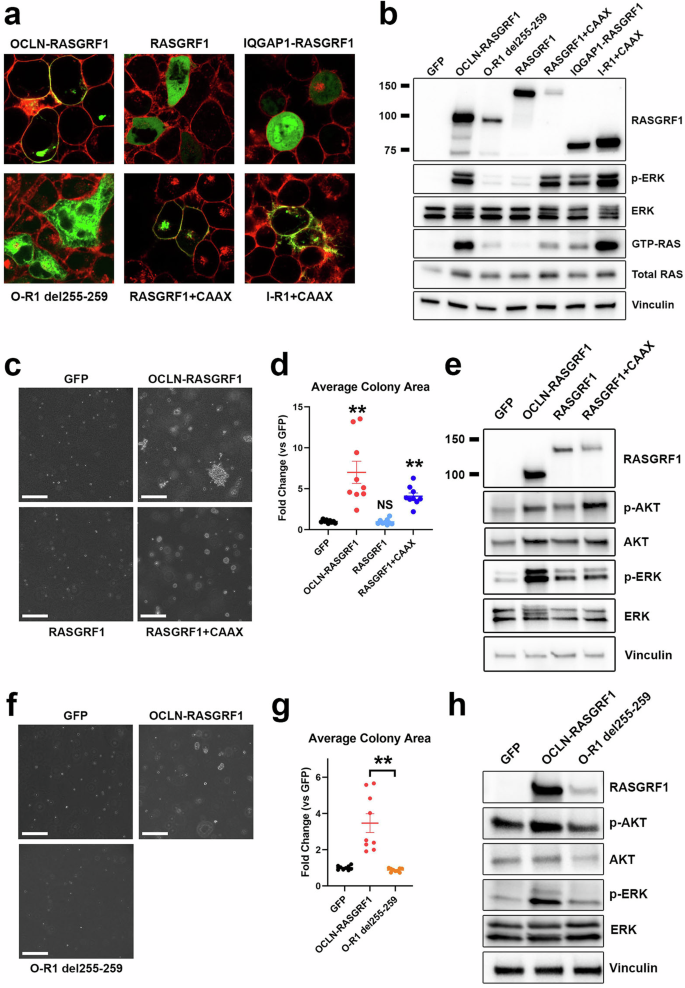
a Confocal imaging of live HEK 293 T cells expressing the indicated GFP-tagged cDNAs (green). Prior to imaging, CellMask Plasma Membrane stain was used to label plasma membranes (red). b Western immunoblotting of lysates from HEK 293 T cells expressing the indicated cDNAs to assess cellular levels of active RAS (GTP-RAS) and ERK activation (p-ERK). Molecular weight is indicated in kDa on the left. O-R1, OCLN–RASGRF1; I-R1, IQGAP1–RASGRF1. c Anchorage-independent proliferation of NIH3T3 cells expressing the indicated cDNAs in soft agar assays. Cells were cultured in soft agar for 19 days. Images are representative of 3 independent experiments. The white marker denotes 300 μm. d Quantification of average colony area for NIH3T3 cells expressing the indicated cDNAs (normalized to GFP) after 19–21 days. Mean and standard error for three independent experiments (with three replicates each) are shown. **, P e Western immunoblotting of lysates from NIH3T3 cells expressing the indicated cDNAs. f As in c, except cells were cultured in soft agar for 15 days. g Quantification of average colony area for NIH3T3 cells expressing the indicated cDNAs (normalized to GFP) after 15–19 days. Mean and standard error for three independent experiments (with three replicates each) are shown. **, P t-test. h Western immunoblotting of lysates from NIH3T3 cells expressing the indicated cDNAs.
Prior studies demonstrated that forced membrane localization of the isolated catalytic domain of RASGRF1 with a C-terminal membrane targeting sequence (CAAX, where A represents an aliphatic amino acid and X is serine or methionine) promotes transforming activity28. We previously reported an oncogenic IQGAP1–RASGRF1 fusion from a sarcoma predicted to include only the first 52 amino acids of IQGAP1 that lacks membrane-spanning domains (and is distinct from the IQGAP1–RASGRF1 fusion identified from a melanoma in the present study)21. We introduced GFP-tagged full-length RASGRF1 or the previously reported IQGAP1–RASGRF1 into HEK 293 T cells and assessed subcellular localization with live cell imaging using confocal microscopy. We observed diffuse cytoplasmic expression of both RASGRF1 and IQGAP1–RASGRF1 (Fig. 4a). We next added a C-terminal CAAX peptide to GFP-tagged RASGRF1 and IQGAP1–RASGRF1 and confirmed plasma membrane localization of these constructs in HEK 293 T cells (Fig. 4a).
We next evaluated the capacity of these RASGRF1 constructs to activate RAS signaling in HEK 293 T cells (Fig. 4b). We noted a marked decrease in levels of GTP-RAS and MAPK signaling with disruption of TM4 (OCLN–RASGRF1 del255–259) compared to OCLN–RASGRF1, suggesting that disruption of plasma membrane localization reduces RAS activation. Ectopic expression of full-length RASGRF1 minimally increased levels of GTP-RAS and MAPK signaling compared to cells expressing GFP as a control (Fig. 4b). However, the addition of a C-terminal CAAX sequence to full-length RASGRF1 increased GTP-RAS and markedly increased MAPK activation (Fig. 4b). These findings indicate that forced membrane localization increases RAS activation mediated by full-length RASGRF1. Similar to our findings with wild-type RASGRF1, the addition of a C-terminal CAAX peptide to IQGAP1–RASGRF1 increased RAS activation (Fig. 4b).
We next evaluated the transforming potential of these RASGRF1 constructs. We introduced them into NIH3T3 mouse fibroblasts and assessed anchorage-independent proliferation in soft agar. Ectopic expression of full-length RASGRF1 in NIH3T3 cells did not promote anchorage-independent proliferation (Fig. 4c, d). Consistent with findings in HEK 293 T, RASGRF1 only modestly promoted RAS signaling (as evidenced by ERK and AKT activation) compared to GFP control (Fig. 4e). The addition of the C-terminal CAAX peptide to RASGRF1 promoted anchorage-independent proliferation but to a lesser extent than observed with OCLN–RASGRF1, consistent with their relative effects on RAS activation in HEK 293 T cells (Fig. 4c, d). Conversely, disruption of TM4 of OCLN–RASGRF1 (OCLN–RASGRF1 del255–259) abrogated anchorage-independent proliferation and reduced RAS signaling (Fig. 4f–h). Together, the findings indicate that membrane localization of wild-type RASGRF1 and RASGRF1 fusions enhances RAS activation and cellular transformation.
OCLN–RASGRF2 fusions promote RAS activation and cellular transformation
Three ATP2B4–RASGRF2 fusions and two ERBIN–RASGRF2 fusions have been previously reported in melanocytic proliferations (n = 4) and a single melanoma lacking other RAS-activating oncogenic alterations22. However, no functional characterization of RASGRF2 fusions has been reported. Among the RASGRF2 fusions identified from our dataset, the most common recurrent rearrangement fused Exon 4 of OCLN with Exon 13 of RASGRF2 (n = 3; Fig. 2d). We designated this OCLN–RASGRF2 fusion as variant 1 (v1; Fig. 5a). Among the identified RASGRF2 fusions, another OCLN–RASGRF2 variant fusing Exon 5 of OCLN with Exon 20 of RASGRF2 (which we designated v3) contains the smallest segment of RASGRF2 (Fig. 5a). The catalytic RAS-GEF domain consists of the CDC25 domain (which catalyzes nucleotide exchange) and the Ras-exchange motif (REM) domain (which binds to RAS substrates)29,30,31. OCLN–RASGRF2 v3 includes the CDC25 domain but lacks the REM domain. As OCLN–RASGRF2 v1 represents the most common RASGRF2 fusion in our dataset and v3 contains the smallest segment of RASGRF2, we generated cDNAs encoding these variants for functional characterization (see Methods).
Fig. 5: Functional characterization and MEK inhibitor sensitivity of RASGRF2 fusions.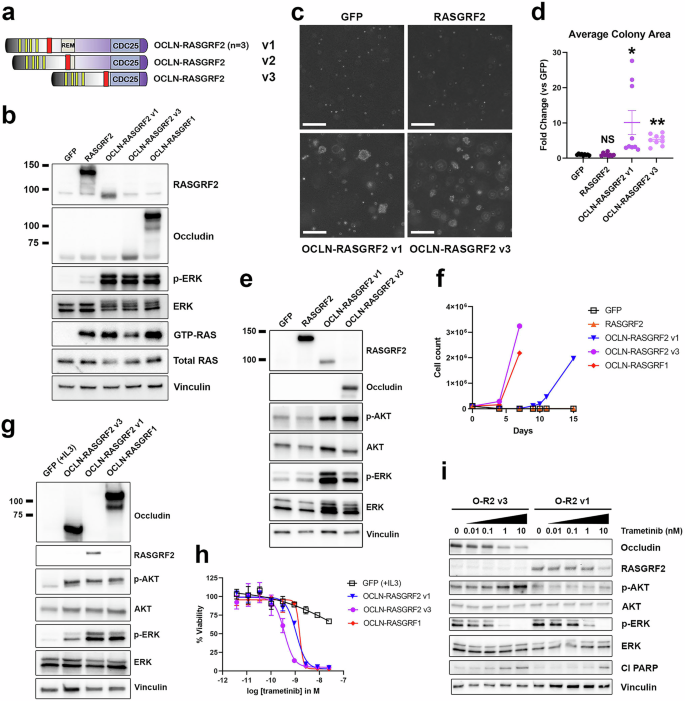
a Structure of five OCLN–RASGRF2 fusions, as in Fig. 2d. Three distinct fusion variants (v1–v3) were identified. b Western immunoblotting of lysates from HEK 293 T cells expressing the indicated cDNAs to assess cellular levels of active RAS (GTP-RAS) and ERK activation (p-ERK). OCLN–RASGRF1 is included as a positive control and comparator for RASGRF2 fusion constructs. OCLN–RASGRF2 v1 contains the epitope recognized by the RASGRF2 antibody but not the occludin antibody. OCLN–RASGRF2 v3 contains the epitope recognized by the occludin antibody but not the RASGRF2 antibody. Molecular weight is indicated in kDa on the left. c Anchorage-independent proliferation of NIH3T3 cells expressing the indicated cDNAs in soft agar assays. Cells were cultured in soft agar for 19 days. Images are representative of three independent experiments. The white marker denotes 300 μm. d Quantification of average colony area for NIH3T3 cells expressing the indicated cDNAs (normalized to GFP) after 19–21 days. Mean and standard error for three independent experiments (with three replicates each) are shown. These data were collected in parallel with those shown in Fig. 4d using the same GFP control. *, P P t-test compared to GFP. NS not significant (compared to GFP). e Western immunoblotting of lysates from NIH3T3 cells expressing the indicated cDNAs. f Proliferation of Ba/F3 cells expressing the indicated cDNAs after withdrawal of IL3 at Day 0. The experiment was performed 3 times. g Western immunoblotting of lysates from Ba/F3 cells expressing the indicated cDNAs. Cells expressing GFP were cultured in the presence of 1 ng/ml IL3. Cells expressing the other cDNAs were cultured in the absence of IL3. h Ba/F3 cells expressing the indicated cDNAs were treated with trametinib at the indicated concentrations. After 4 days, cell viability was determined with Cell Titer-Glo. Cells expressing GFP were cultured with 1 ng/mL IL3. Mean and standard error are shown, and the experiment was performed 3 times. i Western immunoblotting of lysates from Ba/F3 cells expressing OCLN–RASGRF2 v1 or OCLN–RASGRF2 v3 treated with trametinib at the indicated concentrations for 24 h after serum starvation for 4 h. Cl PARP cleaved PARP.
We ectopically expressed OCLN–RASGRF2 v1, OCLN–RASGRF2 v3, full-length RASGRF2, or GFP in HEK 293 T cells. We confirmed ectopic expression of RASGRF2 and RASGRF2 fusions using antibodies against RASGRF2 and occludin (Fig. 5b). A RASGRF2 antibody was used to confirm expression of RASGRF2 and OCLN–RASGRF2 v1. The epitope recognized by this antibody is absent from OCLN–RASGRF2 v3, and an antibody recognizing occludin was therefore used to confirm expression of this fusion. Of note, the epitope recognized by the occludin antibody is absent from OCLN–RASGRF2 v1; thus, that fusion is not detected with this antibody. We next assessed levels of RAS activation associated with these constructs. Ectopic expression of RASGRF2 promoted increased levels of GTP-RAS and a modest increase in MAPK signaling compared to GFP, while both RASGRF2 fusions promoted a marked increase in RAS activation (comparable to that observed with OCLN–RASGRF1; Fig. 5b).
We next introduced these cDNAs into NIH3T3 cells and assessed anchorage-independent proliferation in soft agar. Like full-length RASGRF1, ectopic expression of full-length RASGRF2 did not promote anchorage-independent proliferation (Fig. 5c, d). In contrast, RASGRF2 fusions promoted robust colony formation relative to GFP or RASGRF2 (Fig. 5c, d). Ectopic expression of RASGRF2 fusions in NIH3T3 cells increased MAPK and PI3K signaling, consistent with RAS activation (Fig. 5e).
To further demonstrate their transforming activity, we expressed both OCLN–RASGRF2 fusions in Ba/F3 cells (a mouse hematopoietic cell line dependent on IL3) and assessed the capacity of the fusions to promote IL3-independent proliferation. Upon withdrawal of IL3 from culture media, Ba/F3 cells expressing OCLN–RASGRF2 fusions (but not GFP or RASGRF2) demonstrated robust proliferation (Fig. 5f). We confirmed ectopic expression of OCLN–RASGRF2 fusions, which upregulated MAPK and PI3K signaling (Fig. 5g). We previously demonstrated that both Ba/F3 cells driven by OCLN–RASGRF1 and a pancreatic ductal adenocarcinoma cell line (PaCaDD137) with an endogenous SLC4A4–RASGRF1 fusion are highly sensitive to targeting of the MAPK pathway with the MEK inhibitor trametinib, while relatively insensitive to PI3K inhibition21. We tested the sensitivity of Ba/F3 cells expressing OCLN–RASGRF2 fusions compared to parental Ba/F3 cells (supplemented with IL3) and to OCLN–RASGRF1 (as a positive control). Like OCLN–RASGRF1, Ba/F3 cells driven by OCLN–RASGRF2 v1 or OCLN–RASGRF2 v3 were markedly sensitive to trametinib (Fig. 5h). Parental Ba/F3 cells cultured with IL3 were much less sensitive, suggesting the effect is not due to non-specific toxicity of trametinib in Ba/F3 (Fig. 5h). Trametinib promoted apoptosis in Ba/F3 cells driven by OCLN–RASGRF2 fusions, as evidenced by induction of PARP cleavage with increasing trametinib concentrations (Fig. 5i).
Genetic features of RASGRF fusions associated with transforming phenotypes
Despite lacking membrane-spanning domains, IQGAP1–RASGRF1 promoted increased RAS activation compared to full-length RASGRF1 (Fig. 4b), suggesting that loss of RASGRF1 N-terminal domains may augment catalytic activity. An autoinhibitory mechanism involving the N-terminal Pleckstrin homology (PH) and Dbl homology (DH) domains of the related RAS-GEF SOS1 has been described32,33,34,35. RASGRF1 and RASGRF2 contain two PH domains (PH1 and PH2) in addition to a DH domain in the N-terminus (Fig. 2a, d), and there are reports suggesting RASGRFs may have an analogous autoinhibitory mechanism with loss of N-terminal domains promoting RAS signaling29,36,37. There are conflicting studies, however, and it has also been reported that the DH domain of RASGRF1 is required for RAS activation38,39. RASGRF1 fusions previously shown by us and others to promote cellular transformation lack both the PH1 and DH domains19,21. Most of these previously reported fusions also involve membrane-spanning N-terminal fusion partners. The sole exception is the IQGAP1–RASGRF1 fusion we previously reported from a sarcoma, which does not contain membrane-spanning domains but still promotes cell transformation and tumorigenesis in vivo21. This suggests that disruption of an autoinhibitory mechanism in RASGRF1 as a result of the fusion may be sufficient to promote cell transformation.
While most RASGRF1 and RASGRF2 fusions identified in the present study lack both the PH1 and DH domains (like previously established oncogenic RASGRF1 fusions), some disrupt the PH1 domain but preserve the DH domain. To provide insight into which domains may contribute to RASGRF autoinhibition such that their absence in RASGRF fusions promotes RAS activation and cell transformation, we generated and characterized a series of RASGRF1 N-terminal deletion constructs (Fig. 6a). We compared the ability of full-length RASGRF1, RASGRF1 without the PH1 domain (R1 del1–139), RASGRF1 without the PH1 and DH domains (R1 del1–422), RASGRF1 lacking the PH1, DH, and PH2 domains with preserved REM and CDC25 domains (R1 del1–622), and RASGRF1 with only the CDC25 domain (R1 del1–784) to promote RAS activation (Fig. 6a, b). Compared to GFP, all constructs except R1 del1–784 (containing only the CDC25 domain) increased levels of GTP-RAS and MAPK signaling in HEK 293 T cells (Fig. 6b). We observed that R1 del1–422 and R1 del1–622 (with preserved REM and CDC25 domains but lacking both the PH1 and DH domains) increased RAS activation more robustly than full-length RASGRF1 or R1 del1–139 (lacking only the PH1 domain; Fig. 6b). Of note, expression of R1 del1–139 was less robust than that of the other constructs, which could contribute to its lesser degree of RAS activation.
Fig. 6: Genetic features of RASGRF fusions that contribute to RAS activation and cellular transformation.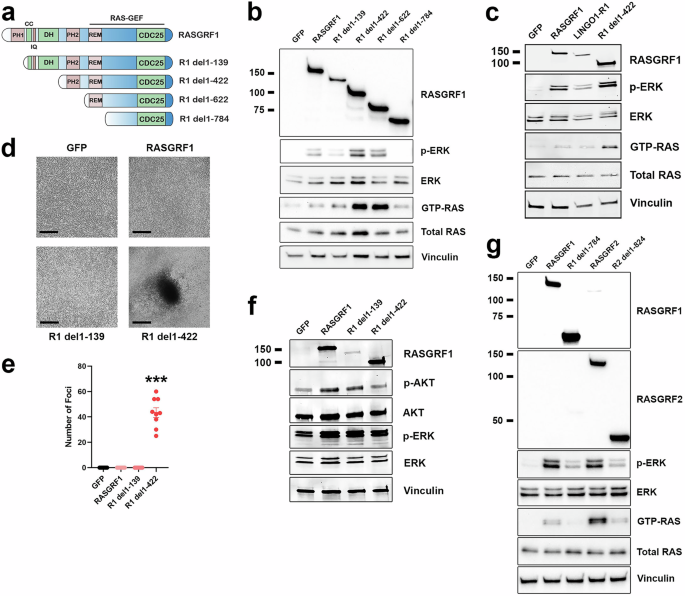
a Structure of full-length RASGRF1 and N-terminal truncation constructs lacking the PH1 domain (R1 del1–139), PH1 and DH domains (R1 del1–422), and constructs preserving only the REM and CDC25 domains (R1 del1–622) or only the CDC25 domain (R1 del1–784). b Western immunoblotting of lysates from HEK 293 T cells expressing the indicated cDNAs to assess cellular levels of active RAS (GTP-RAS) and ERK activation (p-ERK). Molecular weight is indicated in kDa on the left. c Western immunoblotting of lysates from HEK 293 T cells transiently transfected with the indicated cDNAs. LINGO1–R1, LINGO1–RASGRF1. d Tumor cell focus formation in NIH3T3 cells expressing the indicated cDNAs. Cells were cultured for 5 weeks. Images are representative of foci identified in 3 independent experiments. Black marker denotes 300 μm. e Quantification of NIH3T3 cell foci transduced with the indicated cDNAs after 4–6 weeks. Mean and standard error for three independent experiments (with three replicates each) are shown. ***; P f Western immunoblotting of lysates from NIH3T3 cells expressing the indicated cDNAs. g Western immunoblotting of lysates from HEK 293 T cells transiently transfected with the indicated cDNAs.
To confirm that loss of the PH1 and DH domains of RASGRF1 promotes more robust RAS activation than loss of the PH1 domain alone, we generated one of the fusions identified in this study that lacks only the PH1 domain (LINGO1–RASGRF1; Fig. 2a). Based on the findings from Fig. 6b, we hypothesized that this fusion would promote less robust RAS activation compared to RASGRF1 lacking both the PH1 and DH domains. We transiently transfected HEK 293 T cells with GFP, RASGRF1, LINGO1–RASGRF1, or R1 del1–422 (lacking both the PH1 and DH domains). Levels of GTP-RAS and MAPK activation were similar in cells expressing RASGRF1 and LINGO1–RASGRF1 with more robust RAS activation in cells expressing R1 del1–422 (Fig. 6c). These findings are consistent with those of R1 del1–139 in Fig. 6b, suggesting that loss of the PH1 domain alone does not augment RAS activation compared to full-length RASGRF1 in our assays.
We previously demonstrated that IQGAP1–RASGRF1 (which lacks both the PH1 and DH domains and does not include an N-terminal transmembrane fusion partner) promotes proliferation with loss of contact inhibition as a marker of transformation in NIH3T3 cells21. We introduced GFP, full-length RASGRF1, R1 del1–139, or R1 del1–422 into NIH3T3 cells and assayed for proliferation with loss of contact inhibition. We observed that in contrast to cells expressing R1 del1–422 (lacking both the PH1 and DH domains), cells expressing full-length RASGRF1 or R1 del1–139 (without the PH1 domain) did not demonstrate loss of contact inhibition, similar to GFP (Fig. 6d, e). In contrast to our findings in HEK 293 T cells, R1 del1–422 did not clearly increase RAS activation more robustly than full-length RASGRF1 or R1 del1–139 in NIH3T3 cells (although all three constructs did increase RAS activation compared to GFP; Fig. 6f). As in HEK 293 T cells, we noted reduced overall expression of R1 del1–139 compared to the other constructs. Our findings from these assays suggest that the RASGRF fusions identified in this study, without an N-terminal transmembrane partner that lack the PH1 domain but preserve the DH domain, may have limited transforming potential and may not substantially contribute to tumorigenesis.
We note that R1 del1–784 (containing the CDC25 domain but not the REM domain) did not increase RAS activation in HEK 293 T cells (Fig. 6b). While none of the RASGRF1 fusions reported in this study lack the REM domain, 3 of the identified RASGRF2 fusions contain the CDC25 but not the REM domain (Fig. 2d). To determine if the isolated CDC25 domain of RASGRF2 can promote RAS activation, we transiently transfected HEK 293 T cells with an N-terminal deletion construct containing only the CDC25 domain of RASGRF2 (R2 del1–824) compared to full-length RASGRF2, full-length RASGRF1, and R1 del1–784. We found that the isolated CDC25 domains of both RASGRF1 and RASGRF2 promoted less RAS activation compared to their full-length counterparts (Fig. 6g). Thus, our data suggest that the CDC25 domain of RASGRF1 or RASGRF2 alone may be insufficient for RAS activation and cellular transformation unless fused to a membrane-spanning N-terminal partner (as demonstrated with OCLN–RASGRF2 v3 in Fig. 5). These findings are consistent with a prior study demonstrating ectopic expression of the CDC25 domain of RASGRF1 does not promote transformation unless targeted to the plasma membrane28.