To identify genes associated with either adult BMI or T2D risk, we performed association testing using WGS data available in up to 489,941 UKBB participants (Methods). This represents a sample size increase of up to 71,505 people compared to our recent WES analyses of the same cohort9,11, attributable to both an increase in the number of sequenced samples (n = 35,725) and the inclusion of people of non-European ancestry (n = 64,609). Individual gene-burden tests were performed by collapsing rare (minor allele frequency (MAF) 15 (REVEL) score threshold of 0.5 or 0.7. This yielded a total of 81,350 tests (40,750 tests for T2D and 40,600 tests for BMI) for gene masks with at least 30 informative rare allele carriers, corresponding to a conservative multiple-test corrected statistical significance threshold of P −7 (0.05 of 81,350).
Genetic association testing identified a total of 21 genes with at least one mask associated at this threshold with adult BMI (n = 10 genes) or T2D (n = 12 genes) (Fig. 1 and Supplementary Table 1). The only overlapping association between the two traits was with PTVs in UBR3. Our WGS analysis confirmed previously reported gene associations using WES for BMI, including PTVs and damaging missense variants in MC4R, UBR2, SLTM and PCSK1, BSN, APBA1 and PTPRG8,10,13,14. Our WGS analysis also confirmed previously reported gene associations using WES for T2D including PTVs in GCK, HNF1A, GIGYF1 and TNRC6B, and missense variants with REVEL >0.7 in IGF1R11,13. Our WGS gene-burden test seemed statistically well calibrated, as indicated by low exome-wide test statistic inflation (λGC = 1.15 for BMI and 1.20 for T2D) and by the absence of significant associations with any synonymous variant masks (included as a negative control).
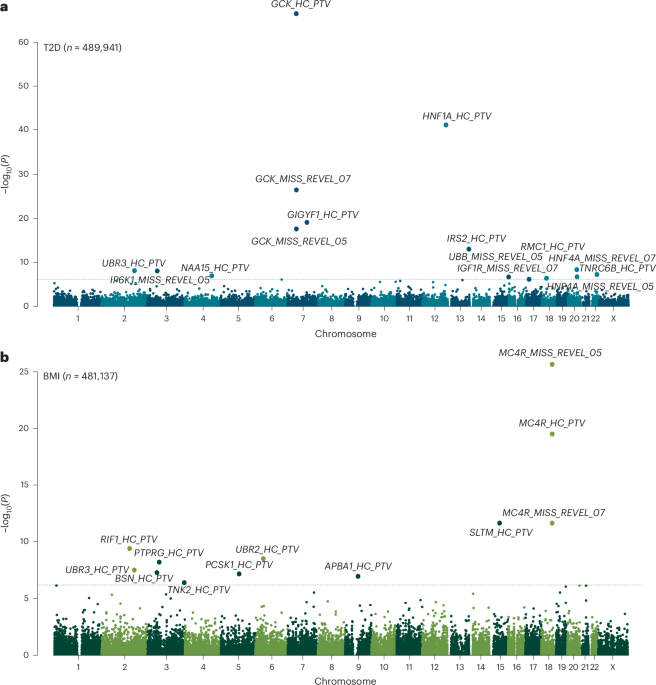
Fig. 1: Genome-wide multi-ancestry gene-burden test for T2D and BMI in UKBB.
a,b, Manhattan plots showing gene-burden test results for T2D (a) and BMI (b) with unadjusted two-sided P values derived from gene-burden testing conducted in BOLT-LMM and plotted on a −log10 scale. Genes passing exome-wide significance (P 6.15 × 10⁻⁷ (0.05/81,350)) are labeled. Points are annotated with variant mask information. MISS–REVEL, missense variants with REVEL scores above 0.5 or 0.7; HC–PTV, high-confidence PTVs.
Identification of new genetic risk factors for BMI
At the three genes that we newly identified for BMI, PTVs conferred higher adult BMI: RIF1, encoding an effector in the nonhomologous end-joining pathway activated in response to double-stranded DNA-breaks16; UBR3, encoding an E3-ubiquitin ligase that is highly expressed in sensory tissues17 and the nonreceptor tyrosine kinase gene TNK2. Previous GWAS also identified loci associated with BMI within 500 kb of TNK2 (BMI: rs34801745:C, beta = 0.013, s.e. = 0.002, P = 7 × 10⁻¹¹) (Supplementary Table 2). Using a variant to gene mapping method18 (Methods), GWAS signals at both the TNK2 loci could be confidently linked to the function of this gene; for example, we observed colocalization between expression quantitative trait loci for TNK2, with decreased expression corresponding to increased BMI, directionally concordant with their rare PTV effects (Supplementary Table 2).
Identification of new genetic risk factors for T2D
At the seven genes that have not been implicated previously by population-scale studies for T2D, PTVs conferred higher risk for T2D: IRS2, encoding a key adapter molecule in the insulin-signaling cascade; UBR3, encoding an E3-ubiquitin ligase that is highly expressed in sensory tissues17; NAA15, encoding a component of N-terminal acetyltransferase complexes19 and RMC1, encoding part of a protein complex critical for lysosomal trafficking and autophagy20,21 (Supplementary Table 1). Our missense mask also identified associations with IP6K1, encoding an inositol phosphokinase, the known MODY gene HNF4A and UBB encoding ubiquitin (Supplementary Table 1). There were also common GWAS loci associated with T2D within 500 kb of IRS2 (T2D: rs9301365:T, beta = 0.024, s.e. = 0.003, P = 2.1 × 10⁻¹⁶), RMC1 (T2D: rs1788819:G, beta = 0.032, s.e. = 0.003, P = 4 × 10⁻²¹), IP6K1 (T2D: rs7613875:A, beta = 0.025, s.e. = 0.003, P = 4.8 × 10⁻¹⁶) and HNF4A (T2D: rs12625671:C, beta = 0.067, s.e. = 0.004, P = 1.7 × 10−68) (Supplementary Table 2). Of these, we could confidently link variants at the IRS2 and HNF4A T2D loci with the corresponding gene’s function (Supplementary Table 2).
Sensitivity analyses
We also tested whether any of our rare variant discoveries were ‘tagged’ by common-variant associations. We generated polygenic risk scores for each trait and included these as covariates. Of our five confirmed new gene-disease associations, four were modestly attenuated (but retained exome-wide significance) and one was modestly strengthened (HNF4A T2D). We performed additional analyses adjusting for regional, common single-variant associations identified directly in UKBB WGS data (MAF > 0.001, P −7) and did not observe any meaningful attenuation in test statistics (Supplementary Tables 20 and 21). These results indicate that the identified rare variant effects on T2D and BMI are independent of common variants (Supplementary Table 3). In addition, as we identified common genetic variation probably acting through IRS2 to be associated with T2D, these results support the presence of a genuine allelic series supporting the role of IRS2 in T2D risk.
As a further sensitivity analysis, we performed ‘leave-one-out analyses,’ which confirmed that none of the above gene-level associations were driven by a single rare variant (Supplementary Table 4). Furthermore, all new associations exhibited similar effects in published results using WES data from UKBB but at subthreshold significance (P ≤ 8.3 × 10⁻⁵).
Increased power using an all-ancestry WGS approach
For most of the associated genes, we observed stronger associations using WGS than we reported previously using WES, with an overall 29% increase in mean chi-square values for these associated genes using similar variant masks (Supplementary Table 5). To ascertain the determinants of this stronger association, we first compared the effect sizes in the current study and our previously published whole-exome analyses (nBMI = 419,668 and nT2D = 418,436), observing comparable effect sizes (Supplementary Fig. 1). Next, we examined the increase in sample size in our all-ancestries based approach to a European-only WGS analysis using otherwise identical analytical parameters. Among the 27 significant associations we identified, 21 had a stronger P value in the all-ancestries sample, with a 4.6% increase in mean chi-square values. To similarly quantify the gain in statistical power using WGS, in the UKBB sample with both WGS and WES data available, WGS produced a 21% increase in mean chi-square values for the associated genes masks (Supplementary Table 5) and included (median = 11.5, quartile 1 to quartile 3: 4.5–16.5) more variants compared to WES. Moreover, sensitivity gene-burden tests considering only those additional carriers identified by WGS (that is, not identified by WES data), 16 of the 23 gene masks with at least five carriers showed a nominally significant association (P IRS2 coding variant detection by WES and WGS in Supplementary Figure 2. Restricting analysis to samples with both WGS and WES sequencing of IRS2, WGS identifies 15 more PTVs than WES (79% increase), resulting in an almost 50% increase in sample size for this mask (Supplementary Table 5). Increased variant discovery did not seem to be restricted to select regions of IRS2 (Supplementary Fig. 2). Our findings confirm and quantify the enhanced coverage of coding variants provided by WGS above WES in UKBB.
Replication in AoU of five new genes associated with BMI and/or T2D
To replicate our findings in UKBB WGS data, we implemented an identical variants annotation workflow for genes identified from UKBB and ran gene-burden testing using WGS data derived from 219,015 participants in the AoU studies. Two of the three new gene associations with BMI (RIF1 and UBR3) were replicated in AoU (at P 2 and Supplementary Table 6), whereas three of the seven gene associations with T2D (IRS2, UBR3 and HNF4A) were replicated in AoUs (Supplementary Table 6). All of these associations remained significant (P 7).
Fig. 2: Discovery and replication of significant associations with BMI and T2D in UKBB and AoU.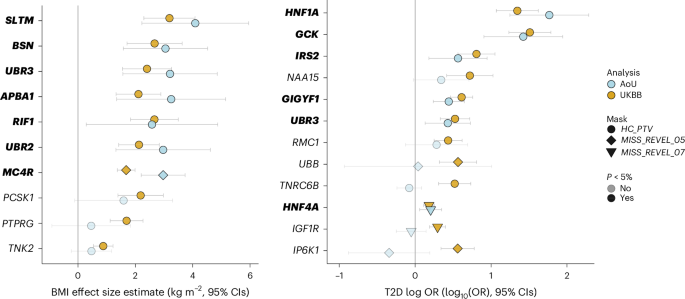
Plots show effect estimates for predicted damaging mutations in the indicated gene on BMI (left) and T2D risk (right) in the UKBB and AoU. In UKBB, effect estimates for BMI were derived using GLMs. In AoU, effect estimates were approximated from score statistics and their variances under a GLM framework. nBMI, UKBB = 481,137; nBMI, AoU = 219,015; nT2D, UKBB = 489,941; nT2D, AoU = 219,015. Odds of T2D are plotted on a log10 scale. All error bars represent 95% CIs and all P values are two-sided. Gene names of results replicated in AoU are highlighted in bold.
To understand whether failed replication was related to limited statistical power, we conducted power calculations after correction for winner’s curse (Methods). For BMI, the risk of type 2 error exceeded 30% for all three of the nonreplicating masks. For T2D, four of the nonreplicating masks had a type 2 error rate exceeding 15%, whereas the other three nonreplicating masks had adequate power (GCK Missense, REVEL >0.5, TNRC6B and NAA15 PTVs) (Supplementary Tables 8 and 9).
A phenotypic association scan reveals a role for IRS2 in human kidney health
To explore the broader phenotypic effects of our identified BMI-raising and T2D risk genes, we conducted a phenotypic association scan (PheWAS) for each gene variant mask significantly associated with T2D and BMI in our discovery analysis (Supplementary Tables 10 and 11). We observed several expected associations, for example, between T2D risk genes with HbA1c and glucose and between BMI genes with whole body fat mass (Fig. 3). However, we were intrigued to observe a new, highly statistically significant association of IRS2 PTVs with lower Cystatin-C-derived estimated glomerular filtration rate (eGFR; effect = −12.92 ml−1 min 1.73 m−2, s.e. = 1.87, P = 4.9 × 10⁻¹², carrier n = 55). This effect of IRS2 PTVs on renal function was consistently observed across three different methods of GFR estimation (Fig. 4). This association does not simply reflect the consequences of T2D-mediated chronic hyperglycemia on renal function as it was also observed in carriers of PTVs in IRS2 without a diagnosis of T2D (Cystatin-C-derived eGFR: effect = −10.42 ml−1 min 1.73 m−2, s.e. = 2.24, P = 3.3 × 10⁻⁶, carrier n = 36), and effects were still observed after including T2D status as a covariate in the model (Supplementary Table 12). Consistent with a renoprotective role for IRS2 in humans, PTVs in IRS2 were associated with an increase of around fourfold in odds of CKD (odds ratio (OR) = 4.0, 95% confidence interval (CI) (1.9–8.6), P = 3.1 × 10⁻⁴, carrier n = 58, 14% case prevalence; Fig. 4). Again, this association persisted after adjustment for diabetes status (Supplementary Table 12). Finally, we sought to demonstrate the robustness of this observation with orthogonal validation in an independent cohort. Therefore, we undertook a lookup of IRS2 in a publicly accessible PheWAS of the AoU Cohort (Methods) and found nominally significant, highly ranked associations for a biomarker of renal function (blood urea nitrogen), CKD and other traits related to renal failure (Supplementary Table 13). These results identify IRS2 as a T2D risk gene with an independent effect on CKD risk.
Fig. 3: PheWAS of BMI and T2D associated genes in UKBB.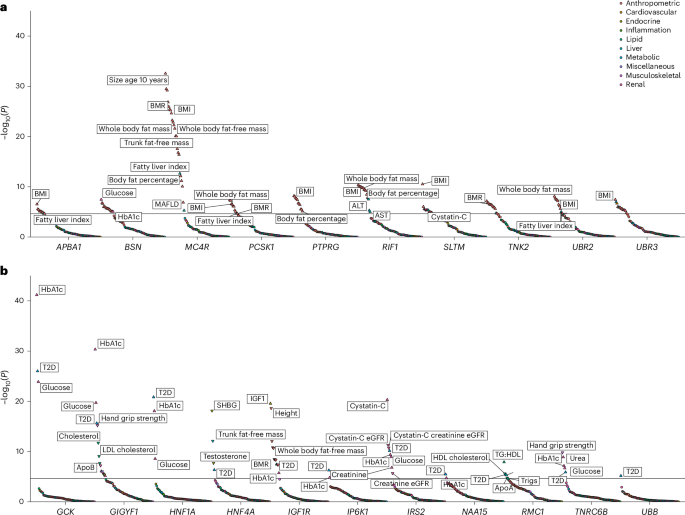
a,b, Effects of the most significant Gene × Mask association with BMI (a) or T2D (b) were assessed (Methods) on a panel of 79 traits, and resulting P values were plotted on a −log10 scale. P values are two-sided and unadjusted. Test statistics were derived from linear and logistic regression models performed using the GLM framework. Numbers of participants are provided in Supplementary Tables 10 and 11. Points are colored according to classification of phenotype; the orientations of triangles indicate the direction of effect for significant traits. For clarity, only a subset of traits and the most significant Gene × Mask association (for genes with more than one mask significantly associated with T2D or BMI) are displayed. UBR3, which was associated with both T2D and BMI in our discovery analysis, is presented alongside BMI risk genes only to avoid duplication. The solid horizontal lines represent a Bonferroni-corrected threshold for statistical significance of 2.35 × 10⁻⁵ (0.05/2,132 Phenotype × Mask associations).
Fig. 4: Loss-of-function variants in IRS2 increase CKD risk.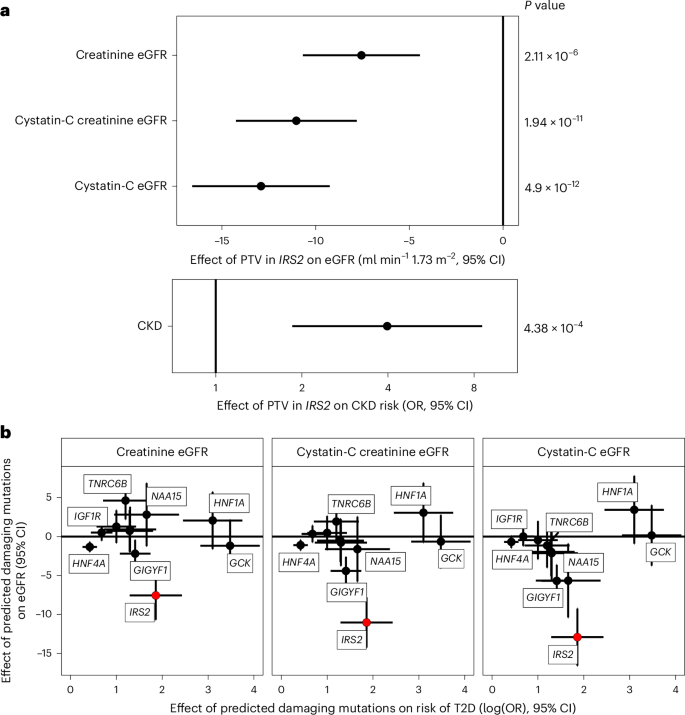
a, Effects of protein truncating variants in IRS2 on various measures of eGFR (ml min−1 1.73m−2) and CKD (OR) are plotted with 95% CIs. All P values are two-sided and unadjusted. The presented summary statistics are derived from linear (eGFR) and logistic regression (CKD risk) implemented in the GLM framework. b, Effects of rare predicted damaging mutations in the labeled genes on T2D risk are plotted (log(OR) T2D risk ± 95% CIs) against the effect on eGFR (beta estimate ± 95% CIs) across three different methods of estimation to illustrate that the effect of PTVs in IRS2 on renal function seem independent of its effect on T2D. For clarity, only the Gene × Mask combination most significantly associated with T2D is plotted. All error bars represent 95% CIs. Plotted test statistics are derived from linear regression for eGFR and from logistic regression for T2D implemented using GLMs. nCKD, T2D = 489,941; nCreatinine eGFR = 461,884; nCystatin-C eGFR = 462,081; nCystatin-C Creatinine eGFR = 461,543.
We also observed that PTVs in the adapter protein GIGYF1 conferred beneficial effects on serum lipids, consistent with previous findings22, but deleterious effects on renal function, including a roughly twofold increase in odds of CKD (Fig. 3 and Supplementary Table 10). We also note a striking reduction in circulating SHBG (sex hormone binding globulin) levels in carriers of predicted damaging missense mutations in HNF4A (effect = −6.4 nmol l−1, s.e. = 0.73, P = 7.5 × 10⁻¹⁹, carrier n = 1,200), which has been reported to regulate SHBG transcription in vitro23. PTVs in RMC1 were associated with higher triglycerides, lower high-density lipoprotein (HDL) (and therefore higher triglyceride (TG):HDL ratio) and increased risk of metabolic (dysfunction)-associated fatty liver disease—a pattern suggestive of lipotoxic insulin resistance.
Evidence of functional diversity in IRS1/IRS2-mediated signaling
IRS1 and IRS2 are critical nodes in the insulin/IGF1 signaling cascade. They are recruited to, and phosphorylated by, the activated insulin receptor, serving as essential adapter molecules to mediate downstream signaling. An interesting finding from mouse genetic studies is that Irs1 knockout mice do not show fasting hyperglycemia, despite evidence of insulin resistance and reduced body size, consistent with impaired growth due to IGF124,25. In contrast, Irs2 knockout mice are comparable in size to their littermate controls but exhibit fasting hyperglycemia and glucose intolerance due to failed beta-cell compensation26. To determine whether similar phenotypic heterogeneity is present in humans, we compared the effects of IRS1 and IRS2 loss of function mutations (Fig. 5 and Supplementary Tables 10 and 11). Consistent with the described mouse biology, human carriers of PTVs in IRS1 had reduced fat-free mass and reduced height, suggestive of impairment in the anabolic effects of IGF1 signaling. In contrast, carriers of PTVs in IRS2 had no changes in lean mass or height, but a substantially increased risk of T2D (Fig. 5). These findings suggest that the functional specificity of IRS1/IRS2 described previously in mice is conserved in humans; IRS1 probably mediates the effects of IGF1 signaling on linear growth and lean mass, whereas IRS2 is relatively more important for glucose tolerance, probably due to its key regulatory actions in the pancreatic beta cell.
Fig. 5: Genetic evidence for functional heterogeneity of insulin receptor substrates in humans.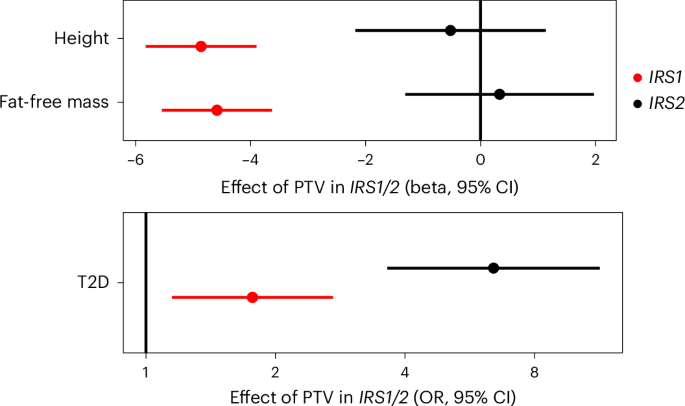
Effects of PTVs in IRS1 and IRS2 on continuous traits are beta-estimates from linear regression plotted in centimeters for height and kilograms for fat-free mass, and as OR from logistic regression for T2D. Odds of T2D are plotted on a log scale. All error bars represent 95% CIs. nFat Free Mass = 481,100; nHeight = 488,455; nT2D = 489,941.
No evidence for a highly penetrant severe insulin resistance syndrome in carriers of IRS2 PTVs
Damaging mutations in canonical members of the insulin signaling cascade can cause highly penetrant monogenic severe insulin resistance syndrome, but there is considerable phenotypic heterogeneity. For example, dominant-negative mutations in INSR cause a monogenic severe insulin resistance syndrome that often presents in adolescence/early adulthood, whereas simple loss-of-function mutations carried in heterozygosity do not cause severe insulin resistance, but probably increase risk of T2D in later life27,28. It is plausible that the T2D risk associated with IRS2 PTVs is a manifestation of a severe insulin resistance syndrome in these carriers. Unfortunately, we cannot test this in UKBB as insulin measurements are unavailable, and surrogate measurements of insulin resistance are not reliable when the affected gene is proximal in the insulin signaling pathway. Therefore, to assess whether IRS2 PTVs may cause a severe monogenic insulin resistance syndrome, we interrogated exome sequence data from The Avon Longitudinal Study of Parents and Children (ALSPAC)29—a birth cohort with fasting insulin measurements available in a substantial subset. We found two carriers of IRS2 PTVs, both of whom had normal (between 2.5th and 97.5th of age and sex matched centiles) serum insulin levels in late adolescence/early adulthood (Supplementary Tables 14 and 15). Thus, it seems unlikely that IRS2 PTVs cause a penetrant monogenic severe insulin resistance syndrome.
E3-ubiquitin ligases UBR2 and UBR3, body composition and cardiometabolic risk
UBR2 and UBR3 are related E3-ubiquitin ligases. UBR2 is a canonical N-recognin that recognizes modified N-terminal amino acid residues (so-called N-degrons) and ubiquitinates these proteins to target them for degradation30,31. UBR3 shares weak homology with UBR2. Although UBR3 does not possess N-recognin activity, it does mediate N-terminal ubiquitination through an as yet unknown degradation signal30,32. In our discovery analyses, UBR2 and UBR3 PTVs were both associated with increased BMI, but only UBR3 conferred a significant increase in T2D risk (Figs. 1 and 3), consistent with distinct molecular actions of the encoded proteins. The association of PTV in UBR3 and T2D was not solely due to increased BMI as the effect on T2D was attenuated only partially after adjustment for BMI (OR = 2.5, 95% CI (1.5–4.1), P = 2.7 × 10⁻⁴). To gain further insight into the mechanism through which UBR3 disruption increases T2D risk, we examined associations with body composition and surrogate markers of insulin resistance measured in UKBB, SHBG and TG:HDL (Supplementary Table 11). We found no evidence for an effect of PTVs in UBR3 on body fat distribution as assessed by WHRadjBMI and inconsistent effects on the surrogate markers of insulin resistance, that is, TG:HDL was not altered but SHBG was nominally decreased.
UBR2 has been implicated in regulation of muscle mass in several mouse studies33,34,35. Therefore, we assessed the effect of UBR2 and UBR3 PTVs on lean and fat mass measured by bioimpedance in UKBB. Carriage of a PTV in UBR2 or UBR3 was associated with higher whole body fat mass and, whereas UBR2 PTV carriers showed a nominal increase in whole body fat-free mass, this association was modest and likely to be a secondary effect of increased adiposity (Supplementary Table 11). Although we did not observe any notable effects of UBR3 PTVs on fat-free mass measurements, maximum hand-grip strength was nominally increased (Supplementary Table 11).
Alongside an increased risk of T2D, the risk of a clinical diagnosis of hypertension was increased significantly in carriers of UBR2 and UBR3 PTVs in our PheWAS analysis, but the effect observed in UBR3 PTV carriers was nearly double that of UBR2. UBR3 seems to increase adiposity from an early age—an effect not apparent for UBR2 in UKBB. It is interesting to speculate that differential regulatory roles of these proteins throughout the life course may underlie the heterogeneity in their effects on cardiometabolic risk (Fig. 6).
Fig. 6: Effects of PTVs in UBR2 and UBR3 on adiposity and cardiometabolic health.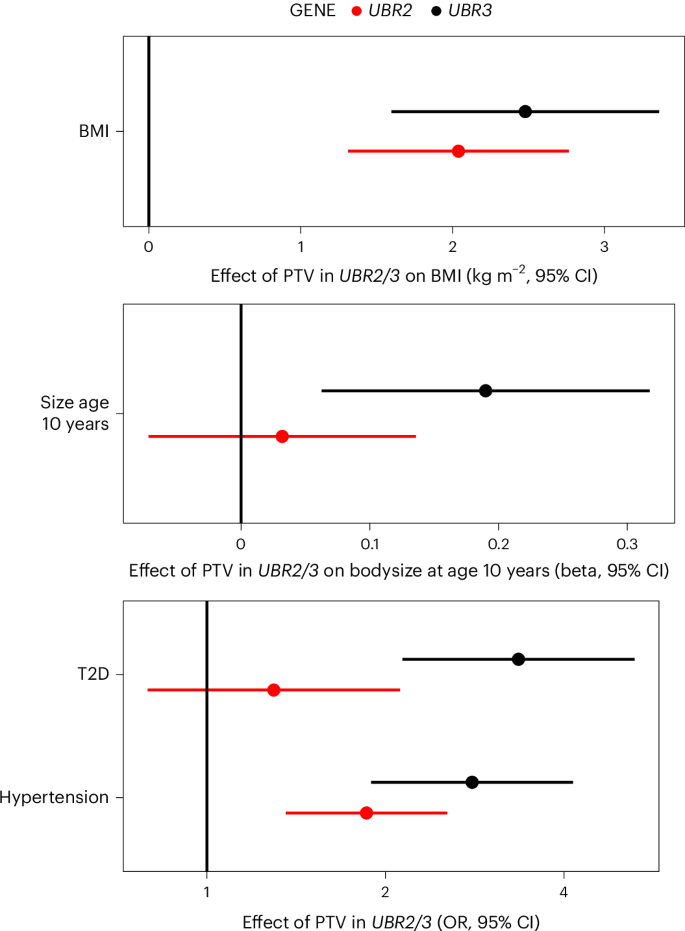
Effects of PTVs in UBR2 and UBR3 on adiposity (adult BMI, body size age 10 years) and cardiometabolic outcomes are plotted. The points represent beta-estimates from linear regression for BMI (kg m−2) and size age 10 years, and ORs derived from logistic regression for T2D and hypertension. All error bars represent 95% CIs. nBMI = 481,137; nsize age 10 = 479,615; nT2D, hypertension = 489,941.